In April, Brazil’s Producer Price Index (IPP) experienced a notable rise of 0.74%.
This marked the third consecutive month of gains, signaling subtle yet significant shifts in the country’s industrial landscape.
Despite a previous year’s overall decline of 3.08%, April’s increase contributed to a modest annual growth of 0.99%.
Brazil’s Producer Price Index (IPP) tracks price changes received by domestic producers, reflecting wholesale inflation.
Sector performances varied. The paper and cellulose industry led with a surge of 3.99%, while pharmaceuticals also rose by 2.10%.
Conversely, extractive industries experienced a 3.58% decrease, according to IBGE data.
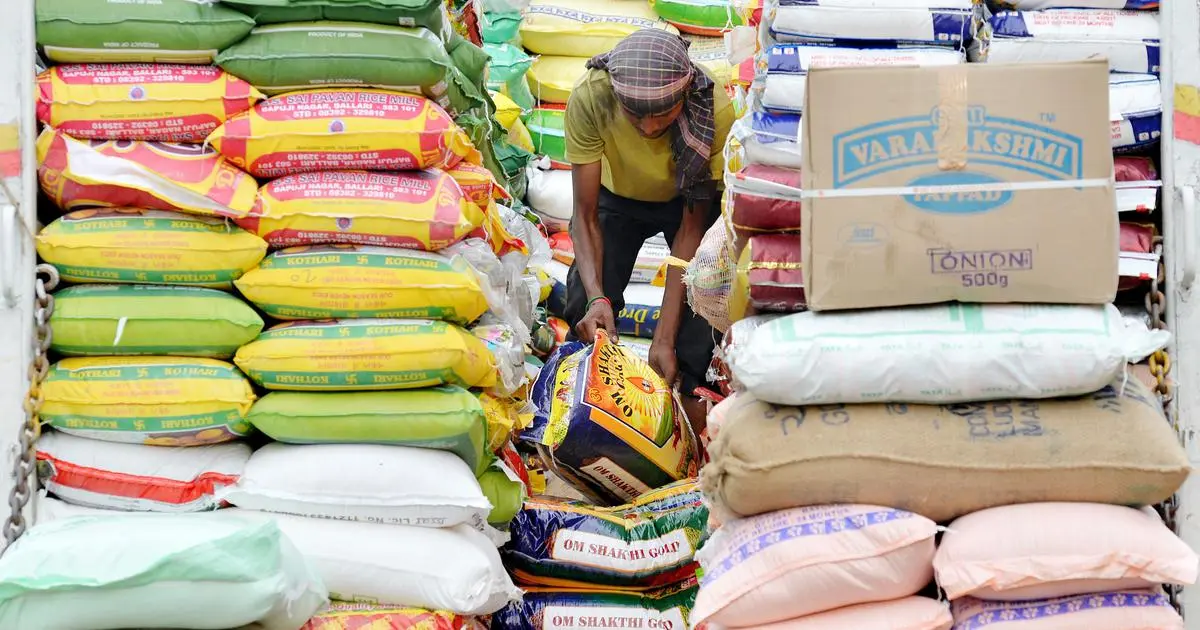
The food sector faced a significant price drop of 1.42% in key commodities like soy, rice, and fresh beef.
Despite this, it added 0.19 percentage points to the overall rise. New harvests and increased livestock numbers contributed to this impact.
The data from April reflects a narrative of resilience and adjustment across various economic sectors.
While capital goods declined by 1.05% in February, consumer goods recorded a modest increase of 0.21%, showing nuanced growth in both durable and non-durable goods.
This sectoral dynamic highlights complex forces, from agricultural cycles to international market dynamics and currency fluctuations.
These price shifts are significant as they impact Brazil’s economic health and have broader implications for global supply chains and trade balances.
Sectors like agriculture and pharmaceuticals can influence global markets, affecting coffee and medication prices.
Investors, policymakers, and consumers must understand these trends to navigate global economic impacts locally.
Brazil’s adaptability highlights its role in the global economy, showing local industries’ connection to worldwide shifts.
Live Market IntelligenceBrazil — Live Market Board
Rio Times · Live Market Intelligence
Brazil — Live Market Board
+0.36%
187,876.56
+0.36%
63,828.60
-0.60%
10,940.10
+0.29%
2,772,419
+0.49%
2,521.18
-0.35%
59,751.67
+0.09%
| Instrument | Last | Change | YoY | Prev. | High | Low | Volume |
|---|---|---|---|---|---|---|---|
| IBOV | 187,876.56 | +0.36% | +21.85% | 187,197.46 | 168,310 | 167,142 | — |
| USD/BRL | 5.16 | +0.01% | -5.13% | 5.16 | 5.18 | 5.14 | — |
| SELIC | 14.00% | — | — | — | — | — | |
| PETR4 | 41.64 | -0.05% | +35.19% | 41.66 | 41.97 | 41.15 | 41,499,400 |
| VALE3 | 72.97 | +0.83% | +30.75% | 72.37 | 73.54 | 72.66 | 17,658,000 |
| ITUB4 | 38.60 | -1.03% | +4.57% | 39.00 | 39.34 | 38.39 | 29,487,800 |
| BBDC4 | 16.85 | +0.36% | +3.50% | 16.79 | 16.90 | 16.67 | 19,416,900 |
| BBAS3 | 19.37 | +0.47% | +0.73% | 19.28 | 19.44 | 19.16 | 11,069,200 |
| B3SA3 | 14.26 | -0.21% | +12.73% | 14.29 | 14.47 | 14.11 | 33,037,800 |
| ABEV3 | 14.89 | -0.80% | +21.91% | 15.01 | 15.07 | 14.81 | 16,453,100 |
| WEGE3 | 47.59 | +0.49% | +29.99% | 47.36 | 48.08 | 47.36 | 3,364,600 |
| PRIO3 | 59.14 | -0.19% | +50.67% | 59.25 | 59.81 | 58.74 | 3,325,600 |
| SUZB3 | 41.33 | +2.35% | -23.55% | 40.38 | 41.48 | 40.35 | 3,914,900 |
| RENT3 | 34.68 | -0.09% | +0.84% | 34.71 | 34.96 | 34.35 | 7,979,100 |
| AZZA3 | 15.89 | -2.63% | -53.76% | 16.32 | 16.42 | 15.82 | 1,330,300 |
| CSNA3 | 4.30 | +0.47% | -42.65% | 4.28 | 4.41 | 4.26 | 10,076,100 |
| GGBR4 | 24.69 | +2.19% | +51.38% | 24.16 | 24.85 | 24.18 | 7,047,600 |
| ENEV3 | 24.21 | -1.38% | +70.49% | 24.55 | 24.64 | 23.99 | 9,297,000 |
This article was produced by The Rio Times’ automated newsroom system. How we use AI · Report an error · Editorial responsibility: Matthias Camenzind, Editor-in-Chief
LatAm Markets: Live Signals → — real-time movers, turnover leaders and FX across Latin America.