IBOV 171,031.73 ▲ 1.85% IPSA 11,338.38 ▲ 0.89% IPC MEX 65,729.18 ▲ 2.14% MERVAL 2,913,184 ▲ 1.30% COLCAP 2,459.23 ▲ 0.61% BVL PERÚ 58,698.13 ▲ 2.60% USD/BRL5.14▼ 0.14% USD/MXN16.90▼ 0.36% USD/CLP914.28— 0.00% USD/COP3,038▼ 1.18% USD/PEN3.35▼ 0.06% USD/ARS1,499▲ 0.12% USD/UYU40.20▲ 1.58% USD/PYG5,996▲ 1.55% USD/BOB11.43▲ 0.41% USD/DOP58.82▲ 0.20% USD/CRC450.05▲ 3.34% USD/GTQ7.62▲ 2.21% USD/HNL26.81▲ 0.31% USD/NIO36.62▲ 0.61% USD/VES778.00▼ 0.13% USD/PAB1.00— 0.00% USD/BZD2.00— 0.00% USD/JMD 157.28 — 0.00% USD/TTD6.71▲ 0.79% EUR/BRL6.00▼ 0.64% BRENT 88.88 ▼ 0.03% WTI 83.11 ▼ 0.11% IRON ORE 161.91 — — COPPER 6.61 ▲ 0.03% GOLD 4,461 ▲ 1.78% SILVER 65.59 ▲ 1.26% SOY 1,184 ▲ 3.20% CORN 480.50 ▲ 10.02% WHEAT 655.00 ▲ 3.93% COFFEE 317.25 ▼ 5.51% SUGAR 16.43 ▼ 1.79% ORANGE JUICE 138.55 ▼ 0.47% COTTON 85.03 ▲ 2.33% COCOA 5,719 ▲ 3.18% BEEF 223.60 ▼ 3.93% CATTLE 339.10 ▼ 3.16% LITHIUM 75.20 ▲ 1.47% PETR4 41.64 ▼ 0.05% VALE3 72.97 ▲ 0.83% ITUB4 38.60 ▼ 1.03% BBDC4 16.85 ▲ 0.36% ABEV3 14.89 ▼ 0.80% BBAS3 19.37 ▲ 0.47% B3SA3 14.26 ▼ 0.21% WEGE3 47.59 ▲ 0.49% PRIO3 59.14 ▼ 0.19% SUZB3 41.33 ▲ 2.35% RENT3 34.68 ▼ 0.09% AZZA3 15.89 ▼ 2.63% CSAN3 3.22 ▼ 1.83% RAIZ4 0.25 — 0.00% PCAR3 2.75 ▼ 0.36% GMAT3 3.65 ▼ 1.08% PSSA3 48.13 ▼ 0.54% CVCB3 1.33 ▼ 2.92% POSI3 3.36 ▲ 2.44% SLCE3 13.34 ▲ 0.30% NATU3 8.14 ▼ 0.73% IBOV 171,031.73 ▲ 1.85% IPSA 11,338.38 ▲ 0.89% IPC MEX 65,729.18 ▲ 2.14% MERVAL 2,913,184 ▲ 1.30% COLCAP 2,459.23 ▲ 0.61% BVL PERÚ 58,698.13 ▲ 2.60% USD/BRL 5.16 ▲ 0.01% USD/MXN 17.06 ▼ 0.24% USD/CLP 913.98 ▲ 0.04% USD/COP 3,140 ▲ 0.03% USD/PEN 3.36 ▼ 0.66% USD/ARS 1,493 ▲ 0.10% USD/UYU 40.27 ▲ 1.24% USD/PYG 5,939 ▲ 1.68% USD/BOB 11.64 ▼ 0.76% USD/DOP 58.34 ▲ 1.25% USD/CRC 445.92 ▲ 0.89% USD/GTQ 7.62 ▲ 2.21% USD/HNL 26.79 ▲ 1.57% USD/NIO 36.62 ▲ 0.69% USD/VES 762.44 ▼ 0.13% USD/PAB 1.00 — 0.00% USD/BZD 2.00 — 0.00% USD/JMD 157.28 — 0.00% USD/TTD 6.70 ▲ 0.61% EUR/BRL 5.95 ▲ 1.01% BRENT 88.88 ▼ 0.03% WTI 83.11 ▼ 0.11% IRON ORE 161.91 — — COPPER 6.61 ▲ 0.03% GOLD 4,461 ▲ 1.78% SILVER 65.59 ▲ 1.26% SOY 1,184 ▲ 3.20% CORN 480.50 ▲ 10.02% WHEAT 655.00 ▲ 3.93% COFFEE 317.25 ▼ 5.51% SUGAR 16.43 ▼ 1.79% ORANGE JUICE 138.55 ▼ 0.47% COTTON 85.03 ▲ 2.33% COCOA 5,719 ▲ 3.18% BEEF 223.60 ▼ 3.93% CATTLE 339.10 ▼ 3.16% LITHIUM 75.20 ▲ 1.47% PETR4 41.64 ▼ 0.05% VALE3 72.97 ▲ 0.83% ITUB4 38.60 ▼ 1.03% BBDC4 16.85 ▲ 0.36% ABEV3 14.89 ▼ 0.80% BBAS3 19.37 ▲ 0.47% B3SA3 14.26 ▼ 0.21% WEGE3 47.59 ▲ 0.49% PRIO3 59.14 ▼ 0.19% SUZB3 41.33 ▲ 2.35% RENT3 34.68 ▼ 0.09% AZZA3 15.89 ▼ 2.63% CSAN3 3.22 ▼ 1.83% RAIZ4 0.25 — 0.00% PCAR3 2.75 ▼ 0.36% GMAT3 3.65 ▼ 1.08% PSSA3 48.13 ▼ 0.54% CVCB3 1.33 ▼ 2.92% POSI3 3.36 ▲ 2.44% SLCE3 13.34 ▲ 0.30% NATU3 8.14 ▼ 0.73%
since 2009
Saturday, August 22, 2026

Brazil’s tax revenues through August at US$274 billion are the highest in the country’s history

By · September 27, 2022 · 2 min read

Daily Brief

The morning intel from across Latin America. Free.

By subscribing you agree to our privacy policy. We never share your email.

In August, Brazil’s federal government tax revenues totaled R$172.3 billion (US$32 billion).

This is the highest result for a month in the historical series that began in 1995.

The Federal Tax Service released the data on Tuesday (Sep. 27).
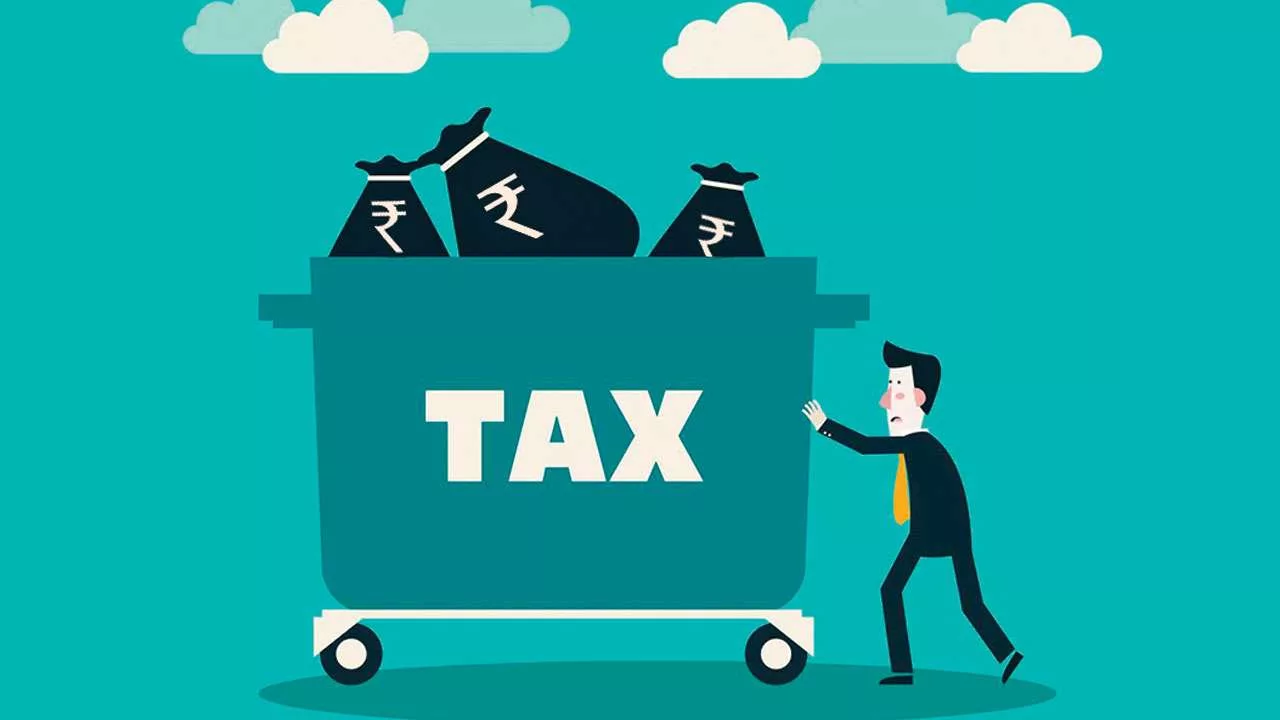
Brazil's tax revenues through August at US$274 billion are the highest in the country's history, (Photo internet reproduction)
Brazil’s tax revenues through August at US$274 billion are the highest in the country’s history, (Photo internet reproduction)
One-stop reference
Company Intelligence
Every listed company in Latin America — financials, ownership and structure for 1,450+ companies across 26 exchanges, in one place.
Browse the directory →

Tax revenues in August comprised R$165.2 billion in revenues managed by tax authorities and R$7.13 billion in funds managed by other authorities.

Revenues increased by 8.2% in real terms in August compared to the same month of 2021, when they amounted to R$159.2 billion, according to the values updated by IPCA (National Wide Consumer Price Index).

However, the amount was lower than in July this year, when it reached R$202.6 billion at current values.

The actual decrease was 14.64%. In all months of 2022, the collection registered a real increase compared to the same period last year.

Compared to August 2021, the tax authorities recorded growth in service tax revenues (+6.30%), payroll (+17.52%), the dollar value of imports (+29.65%), and value of electronic invoices (+6.79%).

On the other hand, there was a decrease in revenues from industrial production (-0.04%) and trade (-6.8%).

In the case of the R$165.8 billion in revenues managed by the Tax Office, the “one-time” figures recorded a loss of R$650 million.

The reduced IPI rates (tax on industrial products) resulted in a loss of R$1.9 billion in August.

Cuts in PIS (social inclusion program) and Cofins (social security financing contribution) for fuels reduced revenues by R$3.75 billion.

However, R$5 billion was paid by companies in IRPJ (corporate income tax) and CSLL (social contribution on net profit).

JANUARY TO AUGUST

From January to August, tax collections totaled R$1.476 trillion (US$274 billion).

This is the highest result in the historical series that began in 1995.

This is 10.17% more than the same period last year.

During this period, revenues managed by the Federal Tax Service totaled R$1.371 trillion, while the balance was R$93.06 billion.

From January to August, payroll recorded the highest growth of 17.9% compared to the same period in 2021.

Live Market IntelligenceBrazil — Live Market BoardInside: market breadth, the sector heatmap, currencies & rates, the Latin America scoreboard and the full instrument board.

Rio Times · Live Market Intelligence

Brazil — Live Market Board

B3 · São Paulo
Aug 22, 2026 · 17:35

Ibovespa · benchmark
171,031.73
+1.85%
L 167,142day rangeH 168,310

+21.85% over 12 months

Market breadth · 15 names
47% advancing

7 ▲ advancing8 declining ▼

Currencies, rates & key inputs
USD / BRL
5.16
+0.01%

EUR / BRL
5.95
+1.01%

Selic rate
14.00%
·

Brent crude
88.88
-0.03%

Iron ore
161.91
·

Sector heatmap · average move today
Materials
+2.35%
SUZB3

Mining
+1.16%
VALE3, CSNA3, GGBR4

Industrials
+0.20%
WEGE3, RENT3

Financials
-0.10%
ITUB4, BBDC4, BBAS3, B3SA3

Energy
-0.12%
PETR4, PRIO3

Consumer Staples
-0.80%
ABEV3

Utilities
-1.38%
ENEV3

Consumer Disc.
-2.63%
AZZA3

Latin America scoreboard
IndexLastTodayStrength
IbovespaBrazil
171,031.73
+1.85%

S&P/BMV IPCMexico
65,729.18
+2.14%

S&P IPSAChile
11,338.38
+0.89%

S&P MERVALArgentina
2,913,184
+1.30%

MSCI COLCAPColombia
2,459.23
+0.61%

BVL S&P PerúPeru
58,698.13
+2.60%

Full instrument board
Instrument Last Change YoY Prev. High Low Volume
IBOV 171,031.73 +1.85% +21.85% 167,927.15 168,310 167,142
USD/BRL 5.16 +0.01% -5.13% 5.16 5.18 5.14
SELIC 14.00%
PETR4 41.64 -0.05% +35.19% 41.66 41.97 41.15 41,499,400
VALE3 72.97 +0.83% +30.75% 72.37 73.54 72.66 17,658,000
ITUB4 38.60 -1.03% +4.57% 39.00 39.34 38.39 29,487,800
BBDC4 16.85 +0.36% +3.50% 16.79 16.90 16.67 19,416,900
BBAS3 19.37 +0.47% +0.73% 19.28 19.44 19.16 11,069,200
B3SA3 14.26 -0.21% +12.73% 14.29 14.47 14.11 33,037,800
ABEV3 14.89 -0.80% +21.91% 15.01 15.07 14.81 16,453,100
WEGE3 47.59 +0.49% +29.99% 47.36 48.08 47.36 3,364,600
PRIO3 59.14 -0.19% +50.67% 59.25 59.81 58.74 3,325,600
SUZB3 41.33 +2.35% -23.55% 40.38 41.48 40.35 3,914,900
RENT3 34.68 -0.09% +0.84% 34.71 34.96 34.35 7,979,100
AZZA3 15.89 -2.63% -53.76% 16.32 16.42 15.82 1,330,300
CSNA3 4.30 +0.47% -42.65% 4.28 4.41 4.26 10,076,100
GGBR4 24.69 +2.19% +51.38% 24.16 24.85 24.18 7,047,600
ENEV3 24.21 -1.38% +70.49% 24.55 24.64 23.99 9,297,000

Largest moves today
AZZA3
15.89
-2.63%
SUZB3
41.33
+2.35%
GGBR4
24.69
+2.19%
IBOV
171,031.73
+1.85%
ENEV3
24.21
-1.38%
ITUB4
38.60
-1.03%
VALE3
72.97
+0.83%
ABEV3
14.89
-0.80%

The session read
The Ibovespa rose 1.85%, with breadth negative — 7 of 15 names higher. Materials led, while Consumer Disc. lagged.

This article was produced by The Rio Times’ automated newsroom system. How we use AI · Report an error

Read More from The Rio Times

The Rio Times · Power Map
See who really holds power in Latin America
Click to open the Power Map

Rotate for Best Experience

This report is optimized for landscape viewing. Rotate your phone for the full experience.