IBOV 186,340.46 ▲ 1.37% IPSA 10,969.49 ▼ 0.78% IPC MEX 64,951.10 ▼ 0.24% MERVAL 2,819,323 ▲ 1.32% COLCAP 2,549.16 ▼ 0.38% BVL PERÚ 60,410.88 ▼ 0.96% USD/BRL5.16▼ 0.76% USD/MXN18.08▲ 0.16% USD/CLP972.03▼ 0.10% USD/COP3,292▼ 2.26% USD/PEN3.45▲ 0.22% USD/ARS1,525▼ 0.03% USD/UYU40.24▲ 3.55% USD/PYG5,817▲ 2.25% USD/BOB11.97▲ 0.66% USD/DOP59.50▲ 0.51% USD/CRC454.26▲ 3.19% USD/GTQ7.64▲ 3.18% USD/HNL26.86▲ 0.43% USD/NIO36.62▲ 0.34% USD/VES858.02— 0.00% USD/PAB1.00— 0.00% USD/BZD2.00— 0.00% USD/JMD 157.28 — 0.00% USD/TTD6.72▲ 2.14% EUR/BRL5.85▼ 1.42% BRENT 88.88 ▼ 0.03% WTI 83.11 ▼ 0.11% IRON ORE 161.91 — — COPPER 6.61 ▲ 0.03% GOLD 4,461 ▲ 1.78% SILVER 65.59 ▲ 1.26% SOY 1,184 ▲ 3.20% CORN 480.50 ▲ 10.02% WHEAT 655.00 ▲ 3.93% COFFEE 317.25 ▼ 5.51% SUGAR 16.43 ▼ 1.79% ORANGE JUICE 138.55 ▼ 0.47% COTTON 85.03 ▲ 2.33% COCOA 5,719 ▲ 3.18% BEEF 223.60 ▼ 3.93% CATTLE 339.10 ▼ 3.16% LITHIUM 75.20 ▲ 1.47% PETR4 41.64 ▼ 0.05% VALE3 72.97 ▲ 0.83% ITUB4 38.60 ▼ 1.03% BBDC4 16.85 ▲ 0.36% ABEV3 14.89 ▼ 0.80% BBAS3 19.37 ▲ 0.47% B3SA3 14.26 ▼ 0.21% WEGE3 47.59 ▲ 0.49% PRIO3 59.14 ▼ 0.19% SUZB3 41.33 ▲ 2.35% RENT3 34.68 ▼ 0.09% AZZA3 15.89 ▼ 2.63% CSAN3 3.22 ▼ 1.83% RAIZ4 0.25 — 0.00% PCAR3 2.75 ▼ 0.36% GMAT3 3.65 ▼ 1.08% PSSA3 48.13 ▼ 0.54% CVCB3 1.33 ▼ 2.92% POSI3 3.36 ▲ 2.44% SLCE3 13.34 ▲ 0.30% NATU3 8.14 ▼ 0.73% IBOV 186,340.46 ▲ 1.37% IPSA 10,969.49 ▼ 0.78% IPC MEX 64,951.10 ▼ 0.24% MERVAL 2,819,323 ▲ 1.32% COLCAP 2,549.16 ▼ 0.38% BVL PERÚ 60,410.88 ▼ 0.96% USD/BRL 5.16 ▲ 0.01% USD/MXN 17.06 ▼ 0.24% USD/CLP 913.98 ▲ 0.04% USD/COP 3,140 ▲ 0.03% USD/PEN 3.36 ▼ 0.66% USD/ARS 1,493 ▲ 0.10% USD/UYU 40.27 ▲ 1.24% USD/PYG 5,939 ▲ 1.68% USD/BOB 11.64 ▼ 0.76% USD/DOP 58.34 ▲ 1.25% USD/CRC 445.92 ▲ 0.89% USD/GTQ 7.62 ▲ 2.21% USD/HNL 26.79 ▲ 1.57% USD/NIO 36.62 ▲ 0.69% USD/VES 762.44 ▼ 0.13% USD/PAB 1.00 — 0.00% USD/BZD 2.00 — 0.00% USD/JMD 157.28 — 0.00% USD/TTD 6.70 ▲ 0.61% EUR/BRL 5.95 ▲ 1.01% BRENT 88.88 ▼ 0.03% WTI 83.11 ▼ 0.11% IRON ORE 161.91 — — COPPER 6.61 ▲ 0.03% GOLD 4,461 ▲ 1.78% SILVER 65.59 ▲ 1.26% SOY 1,184 ▲ 3.20% CORN 480.50 ▲ 10.02% WHEAT 655.00 ▲ 3.93% COFFEE 317.25 ▼ 5.51% SUGAR 16.43 ▼ 1.79% ORANGE JUICE 138.55 ▼ 0.47% COTTON 85.03 ▲ 2.33% COCOA 5,719 ▲ 3.18% BEEF 223.60 ▼ 3.93% CATTLE 339.10 ▼ 3.16% LITHIUM 75.20 ▲ 1.47% PETR4 41.64 ▼ 0.05% VALE3 72.97 ▲ 0.83% ITUB4 38.60 ▼ 1.03% BBDC4 16.85 ▲ 0.36% ABEV3 14.89 ▼ 0.80% BBAS3 19.37 ▲ 0.47% B3SA3 14.26 ▼ 0.21% WEGE3 47.59 ▲ 0.49% PRIO3 59.14 ▼ 0.19% SUZB3 41.33 ▲ 2.35% RENT3 34.68 ▼ 0.09% AZZA3 15.89 ▼ 2.63% CSAN3 3.22 ▼ 1.83% RAIZ4 0.25 — 0.00% PCAR3 2.75 ▼ 0.36% GMAT3 3.65 ▼ 1.08% PSSA3 48.13 ▼ 0.54% CVCB3 1.33 ▼ 2.92% POSI3 3.36 ▲ 2.44% SLCE3 13.34 ▲ 0.30% NATU3 8.14 ▼ 0.73%
since 2009
Thursday, October 1, 2026

Brazil Business - Brazil

Braskem’s 1Q25 Turnaround: Profit Surges, but Cash Flow Challenges Persist

By · May 12, 2025 · 2 min read

The LatAm Brief

One email, every weekday morning. What moved in Latin American markets, politics and expat life.

Yesterday’s subject line: “Colombia decides rates today, near its own debt ceiling”

Free. We send a confirmation link first — nothing arrives until you click it. Unsubscribe with one click in any edition. If you stop opening us for 30 days we stop sending by ourselves, as we assume the interest is no longer there. See our privacy policy. We never share your email.

Braskem S.A., Latin America’s leading petrochemical producer, reported a strong profit rebound in 1Q25, yet cash flow issues linger.

The company’s financial results, announced on May 10, 2025, and stock surge on May 12, fueled by a U.S.-China tariff deal, reveal a complex story. Investors weigh optimism against ongoing financial strain.

The company posted a net profit of R$698 million ($116 million), reversing a R$1.34 billion ($223 million) loss from 1Q24. A R$1.9 billion ($317 million) foreign exchange gain, driven by the Brazilian real’s strength, and a gross margin rise to 6.73% fueled this.

However, negative operating cash flow of R$936 million ($156 million) signals persistent challenges. Recurring EBITDA climbed 16% to R$1.32 billion ($220 million), reflecting higher Brazilian sales and better polyethylene spreads globally.

Revenue grew 9% to R$19.5 billion ($3.25 billion), supported by robust U.S. and European demand. Yet, a 2% EBITDA drop in U.S. dollars highlights currency impacts and global market pressures.
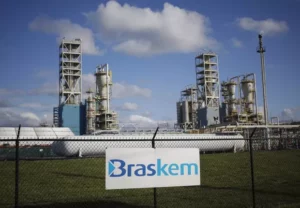
Braskem’s 1Q25 Turnaround: Profit Surges, but Cash Flow Challenges Persist
Braskem’s 1Q25 Turnaround: Profit Surges, but Cash Flow Challenges Persist.
RT
Ask Rio Times
Latin American markets, currencies and companies.
Open the full Ask Rio Times →

Braskem Stock Surges on U.S.-China Tariff Relief

A U.S.-China tariff reduction, announced on May 11, 2025, sparked a 9.66% intraday stock surge to R$10.93. This deal eases trade barriers, boosting Braskem’s export outlook, particularly in North America.

Still, analysts remain cautious, citing a sluggish global petrochemical cycle and high leverage. Braskem’s debt-to-EBITDA ratio rose to 7.8x from 7.2x, driven by negative free cash flow and Alagoas provisions.

High capital expenditures, including the new Mexican ethane terminal, strain liquidity despite a $2.4 billion cash reserve. These investments aim to secure long-term feedstock stability.

Analysts from major banks maintain neutral ratings, with price targets of R$14 ($2.33) to R$18 ($3). They praise operational gains but warn of weak cash flow and uncertain cycle recovery.

The Alagoas geological issue, with R$15.5 billion ($2.58 billion) in provisions, continues to burden finances. Braskem advances sustainability, expanding green ethylene capacity by 37% to 275,000 tons annually.

This move targets premium markets, potentially offsetting commodity price volatility. However, elevated debt and cash burn temper enthusiasm for these strategic gains.

The stock’s rally reflects market optimism, but Braskem’s path forward hinges on petrochemical spread recovery and disciplined spending.

Investors monitor whether operational improvements can outpace financial pressures. The company’s resilience shines, yet its high leverage demands vigilance.

Live Company IntelligenceBraskem S.A — the full investor dossierInside: live share price, market cap, three-year financials, valuation, ESG and peer benchmarks — plus the latest Rio Times coverage.
B
◆ Live Company Intelligence
Braskem
SA: BRKM5BRKM5Basic MaterialsChemicals8,233 employees
R$2.96B
Market cap

Valuation & profitability

Market capR$2.96B
Revenue (TTM)R$70.60B
Profit margin-7.9%
Return on equity-548.8%

Price & risk

52-wk low
$3.52
52-wk high
$13.78
Beta (volatility)0.68
200-day average$8.16

Revenue trend · 6y

20202025
Latest R$70.72B

Ownership

Institutions14.2%
Shares outstanding345M

Dividend

No regular dividend — earnings reinvested for growth.
What Braskem does. Braskem S.A., together with its subsidiaries, engages in the manufacture, sale, import, and export of chemicals, petrochemicals, and fuels in Brazil. The company supplies electricity and other inputs to second-generation producers; sells utilities, such as steam, water, compressed air and industrial gases; industrial services; and engages in the production, supply, and sale…
Data: RT fundamentals (BRKM5.SA) · figures in BRL · as of 30 Sep 2026More company intelligence →

This article was produced by The Rio Times’ automated newsroom system. How we use AI · Report an error

LatAm Markets: Live Signals → — real-time movers, turnover leaders and FX across Latin America.

Read More from The Rio Times

The Rio Times · Power Map
See who really holds power in Latin America
Click to open the Power Map →

Rotate for Best Experience

This report is optimized for landscape viewing. Rotate your phone for the full experience.