Black Monday 2.0: Impact on Asian Stock Markets and Global Comparisons
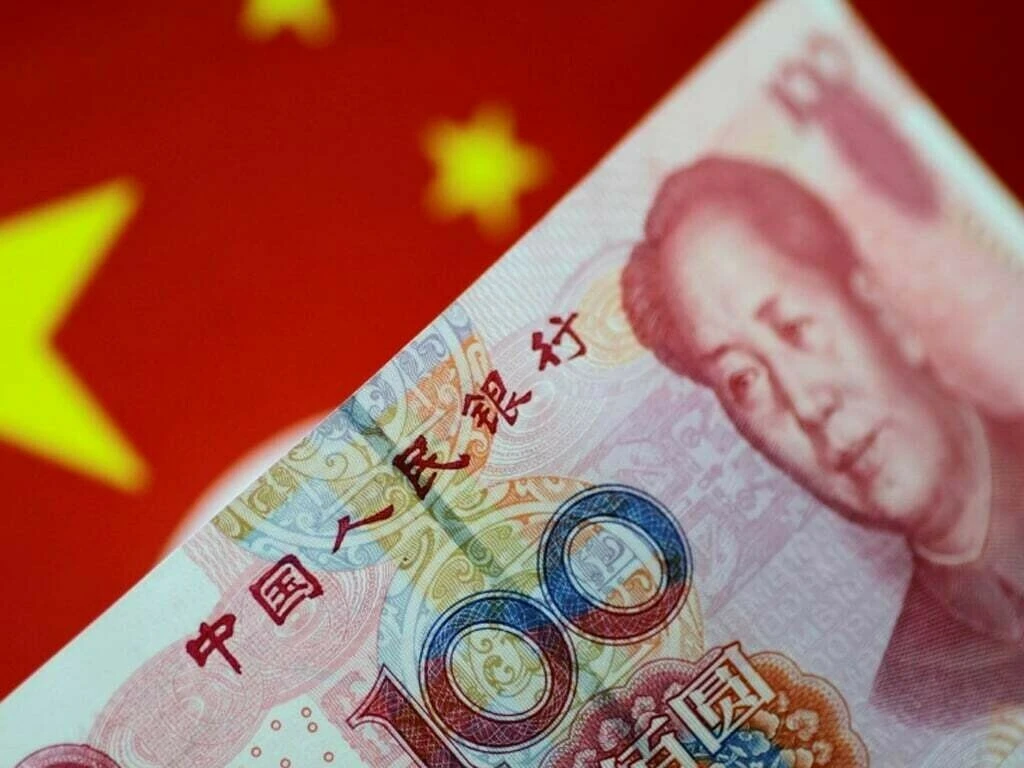
As Black Monday 2.0 sweeps across Asia, the financial landscape is dramatically altered. China’s yuan surged to a seven-month high against the US dollar, driven by the anticipation of US interest rate cuts in September.
The onshore yuan rallied to 7.1150 per US dollar during morning trading and closed at 7.1385, the strongest level since January 2.
The Japanese yen also surged by as much as 3.4% against the US dollar, reflecting the market’s reaction to weak US job data released on Friday.
The Tokyo Stock Exchange faced a historic downturn, with the Nikkei 225 and TOPIX indices recording their largest single-day point drops.
This dramatic decline mirrored the broader sell-off across Asian markets, including significant losses in South Korea and Hong Kong.
The Shanghai and Shenzhen stock exchanges, while somewhat insulated, also saw notable declines.
The ripple effects of Black Monday 2.0 were felt globally, with European markets opening to sharp losses and US stock futures indicating a rough start.
The interconnectedness of global markets was on full display, as fears of a US recession and weak economic data drove a worldwide sell-off.
In summary, Black Monday 2.0 has underscored the vulnerability of global financial markets to economic uncertainties. It has also highlighted the profound impact of US monetary policy decisions.
The performance of the five largest stock markets in Asia highlights the region’s sensitivity to global economic trends.
Meanwhile, the reactions of markets in Europe, North America, and Latin America reflect the pervasive influence of US economic health on global investor sentiment.
The Five Largest Stock Markets in Asia
1. Tokyo Stock Exchange (Japan)
- Performance on Black Monday 2.0: The Nikkei 225 index experienced its largest single-day point drop in history, falling by 12.4%, while the broader TOPIX index fell by 12.23%. This marked the lowest close for both indices since October.
- Factors: The surge in the yen, driven by the Bank of Japan’s interest rate hike, compounded the sell-off.
2. Shanghai Stock Exchange (China)
- Performance on Black Monday 2.0: The Shanghai Composite Index dropped by 1.2%, somewhat insulated by capital controls but still affected by the broader market sentiment.
- Factors: The anticipation of US interest rate cuts and a stronger yuan influenced market movements.
3. Hong Kong Stock Exchange
- Performance on Black Monday 2.0: The Hang Seng Index fell by 2.5% to 16,519.78.
- Factors: The market was impacted by global recession fears and local economic challenges.
4. Shenzhen Stock Exchange (China)
- Performance on Black Monday 2.0: Similar to the Shanghai market, the Shenzhen index saw declines, though specific figures were less dramatic.
- Factors: Economic policies and the performance of tech stocks played a role.
5. Korea Exchange (South Korea)
- Performance on Black Monday 2.0: The Kospi index fell by more than 5%, and the Kosdaq was 3.5% lower.
- Factors: The decline was driven by fears of a global economic slowdown and poor performance in tech stocks.
Benchmarking with Other World Stock Exchanges
Europe
- Performance on Black Monday 2.0: European markets opened with significant losses following the Asian market rout. Key indices such as Germany’s DAX, France’s CAC 40, and the UK’s FTSE 100 fell by over 3%, 2.6%, and 2.3%, respectively.
- Factors: The sell-off was driven by fears of a US recession and weak economic data from the US, which spooked investors globally.
North America
- Performance on Black Monday 2.0: US stock futures indicated a rough opening, with the S&P 500 futures down 2.4% and the Dow Jones Industrial Average futures down 2.6%.
- Factors: The sharp decline in US stocks was triggered by a disappointing jobs report, which heightened fears of an economic slowdown.
Latin America
- Performance on Black Monday 2.0: Latin American markets also felt the impact, though specific figures were less prominent in the immediate aftermath.
- Factors: These markets are often influenced by global economic trends and commodity prices, which are affected by broader market sentiment.
This article was produced by The Rio Times’ automated newsroom system. How we use AI · Report an error · Editorial responsibility: Matthias Camenzind, Editor-in-Chief
In depth