IBOV 186,299.96 ▼ 0.16% IPSA 11,426.61 ▲ 0.61% IPC MEX 63,536.96 ▲ 0.25% MERVAL 2,998,979 — 0.00% COLCAP 2,580.80 ▲ 0.59% BVL PERÚ 59,529.36 ▲ 1.61% USD/BRL5.10▼ 0.13% USD/MXN17.29▲ 0.37% USD/CLP944.67▼ 0.48% USD/COP3,201▲ 0.80% USD/PEN3.38▲ 0.03% USD/ARS1,514▼ 0.02% USD/UYU40.06▲ 2.88% USD/PYG5,918▲ 3.14% USD/BOB11.85▲ 25.24% USD/DOP59.17▲ 3.53% USD/CRC445.27▲ 2.84% USD/GTQ7.63▲ 3.24% USD/HNL26.86▲ 3.32% USD/NIO36.62▲ 2.80% USD/VES850.29▼ 0.13% USD/PAB1.00— 0.00% USD/BZD2.00— 0.00% USD/JMD 157.28 — 0.00% USD/TTD6.74▲ 2.48% EUR/BRL5.84▼ 0.93% BRENT 88.88 ▼ 0.03% WTI 83.11 ▼ 0.11% IRON ORE 161.91 — — COPPER 6.61 ▲ 0.03% GOLD 4,461 ▲ 1.78% SILVER 65.59 ▲ 1.26% SOY 1,184 ▲ 3.20% CORN 480.50 ▲ 10.02% WHEAT 655.00 ▲ 3.93% COFFEE 317.25 ▼ 5.51% SUGAR 16.43 ▼ 1.79% ORANGE JUICE 138.55 ▼ 0.47% COTTON 85.03 ▲ 2.33% COCOA 5,719 ▲ 3.18% BEEF 223.60 ▼ 3.93% CATTLE 339.10 ▼ 3.16% LITHIUM 75.20 ▲ 1.47% PETR4 41.64 ▼ 0.05% VALE3 72.97 ▲ 0.83% ITUB4 38.60 ▼ 1.03% BBDC4 16.85 ▲ 0.36% ABEV3 14.89 ▼ 0.80% BBAS3 19.37 ▲ 0.47% B3SA3 14.26 ▼ 0.21% WEGE3 47.59 ▲ 0.49% PRIO3 59.14 ▼ 0.19% SUZB3 41.33 ▲ 2.35% RENT3 34.68 ▼ 0.09% AZZA3 15.89 ▼ 2.63% CSAN3 3.22 ▼ 1.83% RAIZ4 0.25 — 0.00% PCAR3 2.75 ▼ 0.36% GMAT3 3.65 ▼ 1.08% PSSA3 48.13 ▼ 0.54% CVCB3 1.33 ▼ 2.92% POSI3 3.36 ▲ 2.44% SLCE3 13.34 ▲ 0.30% NATU3 8.14 ▼ 0.73% IBOV 186,299.96 ▼ 0.16% IPSA 11,426.61 ▲ 0.61% IPC MEX 63,536.96 ▲ 0.25% MERVAL 2,998,979 — 0.00% COLCAP 2,580.80 ▲ 0.59% BVL PERÚ 59,529.36 ▲ 1.61% USD/BRL 5.16 ▲ 0.01% USD/MXN 17.06 ▼ 0.24% USD/CLP 913.98 ▲ 0.04% USD/COP 3,140 ▲ 0.03% USD/PEN 3.36 ▼ 0.66% USD/ARS 1,493 ▲ 0.10% USD/UYU 40.27 ▲ 1.24% USD/PYG 5,939 ▲ 1.68% USD/BOB 11.64 ▼ 0.76% USD/DOP 58.34 ▲ 1.25% USD/CRC 445.92 ▲ 0.89% USD/GTQ 7.62 ▲ 2.21% USD/HNL 26.79 ▲ 1.57% USD/NIO 36.62 ▲ 0.69% USD/VES 762.44 ▼ 0.13% USD/PAB 1.00 — 0.00% USD/BZD 2.00 — 0.00% USD/JMD 157.28 — 0.00% USD/TTD 6.70 ▲ 0.61% EUR/BRL 5.95 ▲ 1.01% BRENT 88.88 ▼ 0.03% WTI 83.11 ▼ 0.11% IRON ORE 161.91 — — COPPER 6.61 ▲ 0.03% GOLD 4,461 ▲ 1.78% SILVER 65.59 ▲ 1.26% SOY 1,184 ▲ 3.20% CORN 480.50 ▲ 10.02% WHEAT 655.00 ▲ 3.93% COFFEE 317.25 ▼ 5.51% SUGAR 16.43 ▼ 1.79% ORANGE JUICE 138.55 ▼ 0.47% COTTON 85.03 ▲ 2.33% COCOA 5,719 ▲ 3.18% BEEF 223.60 ▼ 3.93% CATTLE 339.10 ▼ 3.16% LITHIUM 75.20 ▲ 1.47% PETR4 41.64 ▼ 0.05% VALE3 72.97 ▲ 0.83% ITUB4 38.60 ▼ 1.03% BBDC4 16.85 ▲ 0.36% ABEV3 14.89 ▼ 0.80% BBAS3 19.37 ▲ 0.47% B3SA3 14.26 ▼ 0.21% WEGE3 47.59 ▲ 0.49% PRIO3 59.14 ▼ 0.19% SUZB3 41.33 ▲ 2.35% RENT3 34.68 ▼ 0.09% AZZA3 15.89 ▼ 2.63% CSAN3 3.22 ▼ 1.83% RAIZ4 0.25 — 0.00% PCAR3 2.75 ▼ 0.36% GMAT3 3.65 ▼ 1.08% PSSA3 48.13 ▼ 0.54% CVCB3 1.33 ▼ 2.92% POSI3 3.36 ▲ 2.44% SLCE3 13.34 ▲ 0.30% NATU3 8.14 ▼ 0.73%
since 2009
Tuesday, September 22, 2026

Uneven Recovery: Mexico’s Regional Inflation Disparities Persist

By · December 9, 2024 · 2 min read

The LatAm Brief

One email, every weekday morning. What moved in Latin American markets, politics and expat life.

Yesterday’s subject line: “68 strikes, 223 people. A UN expert says murder.”

Free. We send a confirmation link first — nothing arrives until you click it. Unsubscribe with one click in any edition. If you stop opening us for 30 days we stop sending by ourselves, as we assume the interest is no longer there. See our privacy policy. We never share your email.

Mexico’s inflation rate dropped to 4.55% in November 2024, marking its second consecutive month of decline.

This figure, released by the National Institute of Statistics and Geography (INEGI), represents the lowest inflation rate since March 2024. The decrease signals a positive trend in Mexico’s economic landscape.

The core inflation, which excludes volatile items, fell to 3.58%. This component has been steadily decreasing for 22 months straight. Non-core inflation, including more volatile items, also slowed down to 7.60%.

These numbers reflect a gradual stabilization of prices across various sectors. Electricity costs played a significant role in November’s inflation figures. The end of summer subsidies in 18 cities led to a 22.27% monthly increase in electricity prices.

This change highlights the impact of government policies on consumer costs. It also underscores the need for market-driven solutions in the energy sector.
Uneven Recovery: Mexico's Regional Inflation Disparities Persist
Uneven Recovery: Mexico’s Regional Inflation Disparities Persist.
One-stop reference
Company Intelligence
Every listed company in Latin America — financials, ownership and structure for 1,450+ companies across 26 exchanges, in one place.
Browse the directory →
RT
Ask Rio Times
Latin American markets, currencies and companies.
Open the full Ask Rio Times →

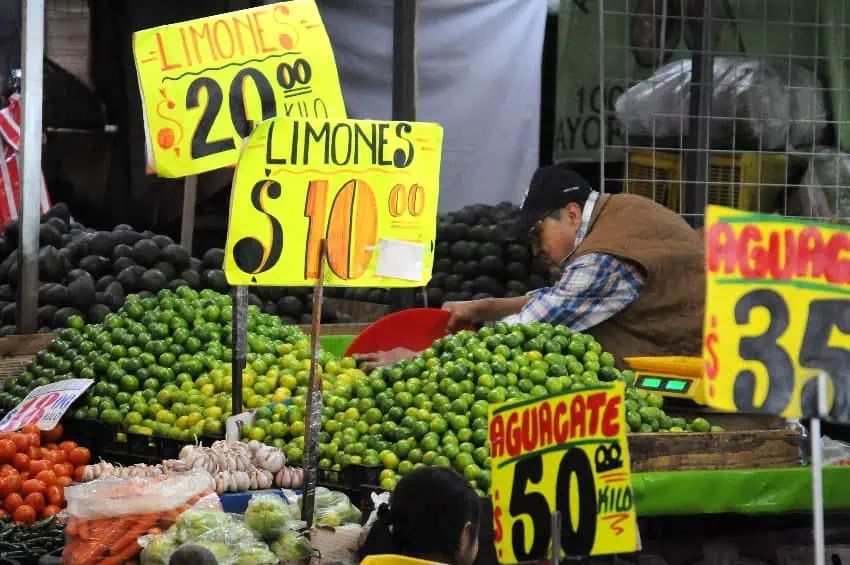
Agricultural products showed mixed price movements. Papaya and onion prices surged by over 22% each. Meanwhile, lemon and zucchini prices dropped by 23.46% and 11.07% respectively.

Mexico’s Inflation Dynamics

These fluctuations demonstrate the dynamic nature of food markets and the importance of free trade. Regional differences in inflation rates were notable. Guerrero experienced the highest rate at 5.9%, while Baja California Sur saw the lowest at 2.4%.

These disparities reflect varying economic conditions across Mexico. They also emphasize the need for localized economic strategies rather than one-size-fits-all policies.

Mexico’s central bank, Banxico, has been actively managing inflation through monetary policy. The bank raised interest rates to combat post-pandemic inflation, peaking at 11.25% in March 2023.

A cautious easing cycle began in 2024, with the current rate at 10.25%. This approach balances economic growth with price stability. Despite the overall positive trend, challenges remain.

Food prices increased by 6.02% annually, outpacing general inflation. The basic consumption basket rose by 4.23%, affecting low-income households.

These figures highlight the ongoing struggle for economic stability among Mexican citizens. Banxico expects inflation to return to its target range by late 2025.

This projection suggests a gradual return to normalcy in Mexico’s economy. However, it also indicates a prolonged period of adjustment for businesses and consumers alike.

Key Facts

Deep Dive

For the complete picture, read our in-depth guide: Mexico Economy 2026: GDP, Peso, Nearshoring, Banxico and Trade

This article was produced by The Rio Times’ automated newsroom system. How we use AI · Report an error

Read More from The Rio Times

The Rio Times · Power Map
See who really holds power in Latin America
Click to open the Power Map

Rotate for Best Experience

This report is optimized for landscape viewing. Rotate your phone for the full experience.