IBOV 186,340.46 ▲ 1.37% IPSA 10,969.49 ▼ 0.78% IPC MEX 64,951.10 ▼ 0.24% MERVAL 2,819,323 ▲ 1.32% COLCAP 2,549.16 ▼ 0.38% BVL PERÚ 60,410.88 ▼ 0.96% USD/BRL5.16▼ 0.76% USD/MXN18.08▲ 0.20% USD/CLP972.03▼ 0.10% USD/COP3,292▼ 2.26% USD/PEN3.45▲ 0.23% USD/ARS1,525▼ 0.03% USD/UYU40.24▲ 3.55% USD/PYG5,817▲ 2.25% USD/BOB11.97▲ 0.66% USD/DOP59.50▲ 0.51% USD/CRC454.26▲ 3.19% USD/GTQ7.64▲ 3.18% USD/HNL26.86▲ 0.43% USD/NIO36.62▲ 0.34% USD/VES858.02— 0.00% USD/PAB1.00— 0.00% USD/BZD2.00— 0.00% USD/JMD 157.28 — 0.00% USD/TTD6.72▲ 2.14% EUR/BRL5.85▼ 1.40% BRENT 88.88 ▼ 0.03% WTI 83.11 ▼ 0.11% IRON ORE 161.91 — — COPPER 6.61 ▲ 0.03% GOLD 4,461 ▲ 1.78% SILVER 65.59 ▲ 1.26% SOY 1,184 ▲ 3.20% CORN 480.50 ▲ 10.02% WHEAT 655.00 ▲ 3.93% COFFEE 317.25 ▼ 5.51% SUGAR 16.43 ▼ 1.79% ORANGE JUICE 138.55 ▼ 0.47% COTTON 85.03 ▲ 2.33% COCOA 5,719 ▲ 3.18% BEEF 223.60 ▼ 3.93% CATTLE 339.10 ▼ 3.16% LITHIUM 75.20 ▲ 1.47% PETR4 41.64 ▼ 0.05% VALE3 72.97 ▲ 0.83% ITUB4 38.60 ▼ 1.03% BBDC4 16.85 ▲ 0.36% ABEV3 14.89 ▼ 0.80% BBAS3 19.37 ▲ 0.47% B3SA3 14.26 ▼ 0.21% WEGE3 47.59 ▲ 0.49% PRIO3 59.14 ▼ 0.19% SUZB3 41.33 ▲ 2.35% RENT3 34.68 ▼ 0.09% AZZA3 15.89 ▼ 2.63% CSAN3 3.22 ▼ 1.83% RAIZ4 0.25 — 0.00% PCAR3 2.75 ▼ 0.36% GMAT3 3.65 ▼ 1.08% PSSA3 48.13 ▼ 0.54% CVCB3 1.33 ▼ 2.92% POSI3 3.36 ▲ 2.44% SLCE3 13.34 ▲ 0.30% NATU3 8.14 ▼ 0.73% IBOV 186,340.46 ▲ 1.37% IPSA 10,969.49 ▼ 0.78% IPC MEX 64,951.10 ▼ 0.24% MERVAL 2,819,323 ▲ 1.32% COLCAP 2,549.16 ▼ 0.38% BVL PERÚ 60,410.88 ▼ 0.96% USD/BRL 5.16 ▲ 0.01% USD/MXN 17.06 ▼ 0.24% USD/CLP 913.98 ▲ 0.04% USD/COP 3,140 ▲ 0.03% USD/PEN 3.36 ▼ 0.66% USD/ARS 1,493 ▲ 0.10% USD/UYU 40.27 ▲ 1.24% USD/PYG 5,939 ▲ 1.68% USD/BOB 11.64 ▼ 0.76% USD/DOP 58.34 ▲ 1.25% USD/CRC 445.92 ▲ 0.89% USD/GTQ 7.62 ▲ 2.21% USD/HNL 26.79 ▲ 1.57% USD/NIO 36.62 ▲ 0.69% USD/VES 762.44 ▼ 0.13% USD/PAB 1.00 — 0.00% USD/BZD 2.00 — 0.00% USD/JMD 157.28 — 0.00% USD/TTD 6.70 ▲ 0.61% EUR/BRL 5.95 ▲ 1.01% BRENT 88.88 ▼ 0.03% WTI 83.11 ▼ 0.11% IRON ORE 161.91 — — COPPER 6.61 ▲ 0.03% GOLD 4,461 ▲ 1.78% SILVER 65.59 ▲ 1.26% SOY 1,184 ▲ 3.20% CORN 480.50 ▲ 10.02% WHEAT 655.00 ▲ 3.93% COFFEE 317.25 ▼ 5.51% SUGAR 16.43 ▼ 1.79% ORANGE JUICE 138.55 ▼ 0.47% COTTON 85.03 ▲ 2.33% COCOA 5,719 ▲ 3.18% BEEF 223.60 ▼ 3.93% CATTLE 339.10 ▼ 3.16% LITHIUM 75.20 ▲ 1.47% PETR4 41.64 ▼ 0.05% VALE3 72.97 ▲ 0.83% ITUB4 38.60 ▼ 1.03% BBDC4 16.85 ▲ 0.36% ABEV3 14.89 ▼ 0.80% BBAS3 19.37 ▲ 0.47% B3SA3 14.26 ▼ 0.21% WEGE3 47.59 ▲ 0.49% PRIO3 59.14 ▼ 0.19% SUZB3 41.33 ▲ 2.35% RENT3 34.68 ▼ 0.09% AZZA3 15.89 ▼ 2.63% CSAN3 3.22 ▼ 1.83% RAIZ4 0.25 — 0.00% PCAR3 2.75 ▼ 0.36% GMAT3 3.65 ▼ 1.08% PSSA3 48.13 ▼ 0.54% CVCB3 1.33 ▼ 2.92% POSI3 3.36 ▲ 2.44% SLCE3 13.34 ▲ 0.30% NATU3 8.14 ▼ 0.73%
since 2009
Thursday, October 1, 2026

U.S. Trade Deficit Hits $78.2 Billion, Highest Since March 2022

By · January 7, 2025 · 2 min read

The LatAm Brief

One email, every weekday morning. What moved in Latin American markets, politics and expat life.

Yesterday’s subject line: “Colombia decides rates today, near its own debt ceiling”

Free. We send a confirmation link first — nothing arrives until you click it. Unsubscribe with one click in any edition. If you stop opening us for 30 days we stop sending by ourselves, as we assume the interest is no longer there. See our privacy policy. We never share your email.

The U.S. trade deficit widened to $78.2 billion in November 2024, marking the largest gap since March 2022. This 6.2% increase from October’s revised $73.6 billion deficit reflects a surge in imports outpacing export growth.

Imports jumped 3.4% to $351.6 billion, the fastest pace in over two years. This rise stemmed from increased purchases of industrial supplies, capital goods, and food products.

Notably, semiconductor imports grew by $1.2 billion, while crude oil imports rose by $1.0 billion. Exports also climbed, but at a slower 2.7% rate, reaching $273.4 billion.

Free daily brief — no card needed
Get every North America story in one morning email
We build you a personalized brief around the topics you follow — free for 7 days. Love it? Your first month after that is US$1.

Industrial supplies, materials, and automotive exports led this growth. The goods deficit expanded by $5.4 billion to $103.4 billion, while the services surplus increased slightly to $25.2 billion.

Trade deficits with major partners showed mixed results. The gap with China remained substantial at $25.4 billion. Deficits with the European Union and Mexico stood at $20.5 billion and $15.4 billion, respectively.
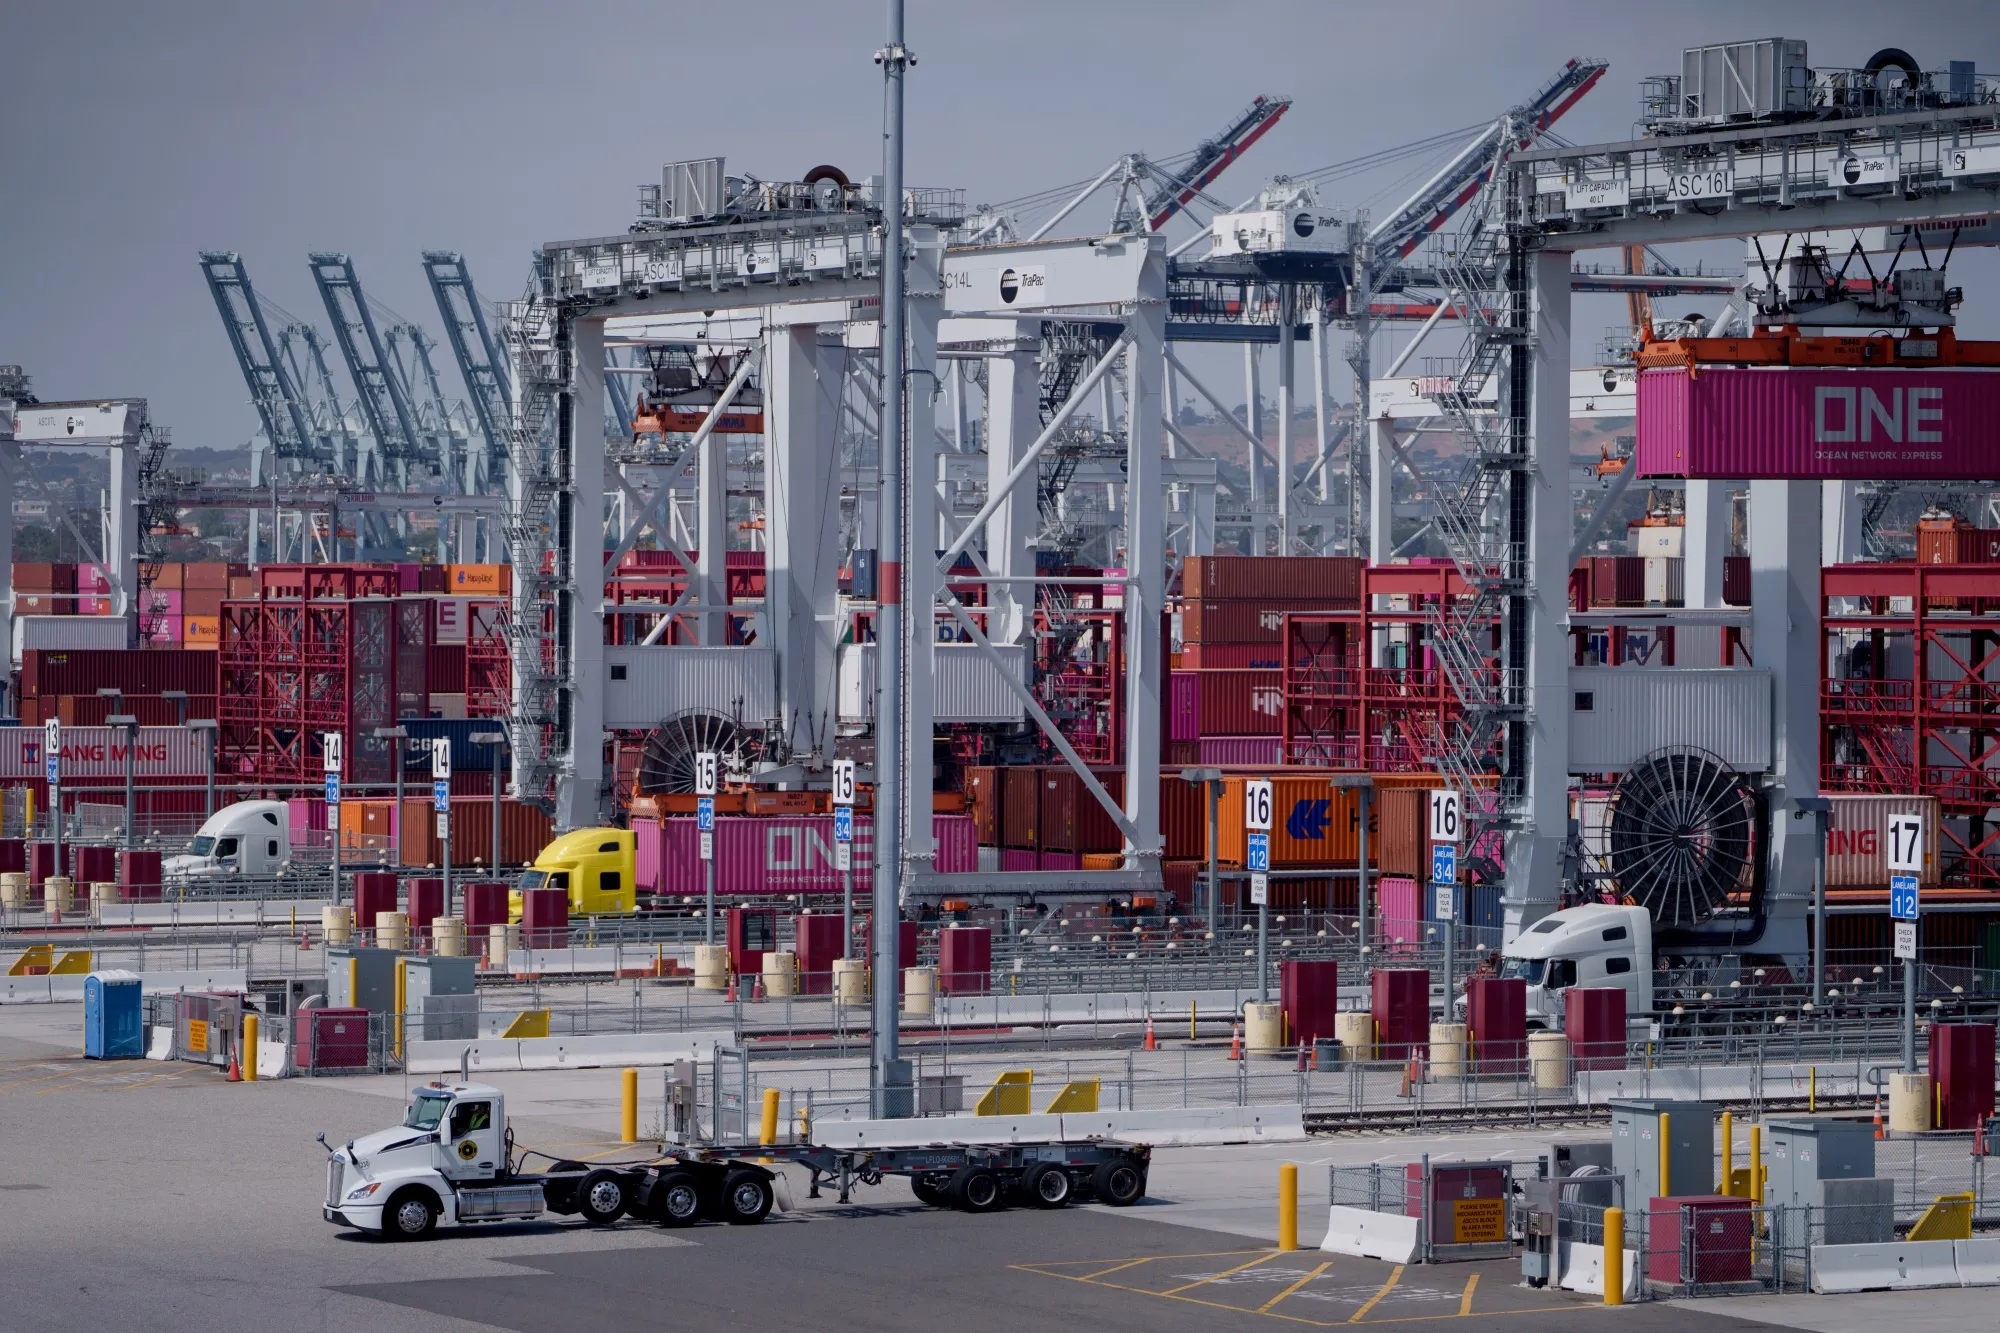
U.S. Trade Deficit Hits $78.2 Billion, Highest Since March 2022
U.S. Trade Deficit Hits $78.2 Billion, Highest Since March 2022.
One-stop reference
Company Intelligence
Every listed company in Latin America — financials, ownership and structure for 1,450+ companies across 26 exchanges, in one place.
Browse the directory →
RT
Ask Rio Times
17 years of Latin America reporting, on demand.
Open the full Ask Rio Times →

Interestingly, the deficit with Japan narrowed by $1.2 billion to $5.3 billion. Year-to-date, the U.S. trade deficit has grown by 13.0% compared to 2023. Exports rose by 4.0%, while imports increased by 5.8%.

This trend highlights ongoing challenges in balancing international trade amid global economic uncertainties. The widening deficit may pressure the U.S. dollar, potentially contributing to a bearish short-term outlook.

However, economists expect its impact on Q4 2024 GDP growth to remain neutral, with broader economic conditions and inflationary pressures playing crucial roles.

This article was produced by The Rio Times’ automated newsroom system. How we use AI · Report an error

Read More from The Rio Times

The Rio Times · Power Map
See who really holds power in Latin America
Click to open the Power Map →

Rotate for Best Experience

This report is optimized for landscape viewing. Rotate your phone for the full experience.