IBOV 206,505.98 ▼ 0.18% IPSA 10,966.21 ▼ 0.49% IPC MEX 66,790.35 ▼ 0.26% MERVAL 2,835,843 — 0.00% COLCAP 2,582.29 ▲ 0.46% BVL PERÚ 60,511.74 ▼ 1.60% USD/BRL5.03▲ 0.12% USD/MXN18.48▼ 0.07% USD/CLP984.93▲ 0.25% USD/COP3,192▲ 0.11% USD/PEN3.44▲ 0.21% USD/ARS1,513▼ 0.02% USD/UYU40.20▲ 3.25% USD/PYG5,684▲ 3.29% USD/BOB11.65▲ 2.18% USD/DOP61.11▼ 0.03% USD/CRC449.35▲ 1.91% USD/GTQ7.64▲ 3.17% USD/HNL26.86▲ 0.35% USD/NIO36.62▼ 0.07% USD/VES876.92▼ 0.13% USD/PAB1.00— 0.00% USD/BZD2.00— 0.00% USD/JMD 157.28 — 0.00% USD/TTD6.77▲ 2.81% EUR/BRL5.64▲ 0.23% BRENT 88.88 ▼ 0.03% WTI 83.11 ▼ 0.11% IRON ORE 161.91 — — COPPER 6.61 ▲ 0.03% GOLD 4,461 ▲ 1.78% SILVER 65.59 ▲ 1.26% SOY 1,184 ▲ 3.20% CORN 480.50 ▲ 10.02% WHEAT 655.00 ▲ 3.93% COFFEE 317.25 ▼ 5.51% SUGAR 16.43 ▼ 1.79% ORANGE JUICE 138.55 ▼ 0.47% COTTON 85.03 ▲ 2.33% COCOA 5,719 ▲ 3.18% BEEF 223.60 ▼ 3.93% CATTLE 339.10 ▼ 3.16% LITHIUM 75.20 ▲ 1.47% PETR4 41.64 ▼ 0.05% VALE3 72.97 ▲ 0.83% ITUB4 38.60 ▼ 1.03% BBDC4 16.85 ▲ 0.36% ABEV3 14.89 ▼ 0.80% BBAS3 19.37 ▲ 0.47% B3SA3 14.26 ▼ 0.21% WEGE3 47.59 ▲ 0.49% PRIO3 59.14 ▼ 0.19% SUZB3 41.33 ▲ 2.35% RENT3 34.68 ▼ 0.09% AZZA3 15.89 ▼ 2.63% CSAN3 3.22 ▼ 1.83% RAIZ4 0.25 — 0.00% PCAR3 2.75 ▼ 0.36% GMAT3 3.65 ▼ 1.08% PSSA3 48.13 ▼ 0.54% CVCB3 1.33 ▼ 2.92% POSI3 3.36 ▲ 2.44% SLCE3 13.34 ▲ 0.30% NATU3 8.14 ▼ 0.73% IBOV 206,505.98 ▼ 0.18% IPSA 10,966.21 ▼ 0.49% IPC MEX 66,790.35 ▼ 0.26% MERVAL 2,835,843 — 0.00% COLCAP 2,582.29 ▲ 0.46% BVL PERÚ 60,511.74 ▼ 1.60% USD/BRL 5.16 ▲ 0.01% USD/MXN 17.06 ▼ 0.24% USD/CLP 913.98 ▲ 0.04% USD/COP 3,140 ▲ 0.03% USD/PEN 3.36 ▼ 0.66% USD/ARS 1,493 ▲ 0.10% USD/UYU 40.27 ▲ 1.24% USD/PYG 5,939 ▲ 1.68% USD/BOB 11.64 ▼ 0.76% USD/DOP 58.34 ▲ 1.25% USD/CRC 445.92 ▲ 0.89% USD/GTQ 7.62 ▲ 2.21% USD/HNL 26.79 ▲ 1.57% USD/NIO 36.62 ▲ 0.69% USD/VES 762.44 ▼ 0.13% USD/PAB 1.00 — 0.00% USD/BZD 2.00 — 0.00% USD/JMD 157.28 — 0.00% USD/TTD 6.70 ▲ 0.61% EUR/BRL 5.95 ▲ 1.01% BRENT 88.88 ▼ 0.03% WTI 83.11 ▼ 0.11% IRON ORE 161.91 — — COPPER 6.61 ▲ 0.03% GOLD 4,461 ▲ 1.78% SILVER 65.59 ▲ 1.26% SOY 1,184 ▲ 3.20% CORN 480.50 ▲ 10.02% WHEAT 655.00 ▲ 3.93% COFFEE 317.25 ▼ 5.51% SUGAR 16.43 ▼ 1.79% ORANGE JUICE 138.55 ▼ 0.47% COTTON 85.03 ▲ 2.33% COCOA 5,719 ▲ 3.18% BEEF 223.60 ▼ 3.93% CATTLE 339.10 ▼ 3.16% LITHIUM 75.20 ▲ 1.47% PETR4 41.64 ▼ 0.05% VALE3 72.97 ▲ 0.83% ITUB4 38.60 ▼ 1.03% BBDC4 16.85 ▲ 0.36% ABEV3 14.89 ▼ 0.80% BBAS3 19.37 ▲ 0.47% B3SA3 14.26 ▼ 0.21% WEGE3 47.59 ▲ 0.49% PRIO3 59.14 ▼ 0.19% SUZB3 41.33 ▲ 2.35% RENT3 34.68 ▼ 0.09% AZZA3 15.89 ▼ 2.63% CSAN3 3.22 ▼ 1.83% RAIZ4 0.25 — 0.00% PCAR3 2.75 ▼ 0.36% GMAT3 3.65 ▼ 1.08% PSSA3 48.13 ▼ 0.54% CVCB3 1.33 ▼ 2.92% POSI3 3.36 ▲ 2.44% SLCE3 13.34 ▲ 0.30% NATU3 8.14 ▼ 0.73%
since 2009
Thursday, October 15, 2026

Market Reports North America

U.S. Industrial Output Marks Steepest Drop Since January

By · August 15, 2024 · 2 min read

In July, U.S. industrial production fell by 0.6%, marking the most significant decline since the year’s start.

This drop was primarily due to a decrease in manufacturing output, which suffered notably from Hurricane Beryl’s effects on the Gulf Coast.

The storm hit eastern Texas early in the month, causing massive power outages that disrupted millions of businesses and homes.

The Federal Reserve pinpointed the hurricane as a key factor behind a 0.3% reduction in overall factory output.

Additionally, a specific 0.6% fall in motor vehicle production exacerbated the overall manufacturing slowdown.

The LatAm Brief

One email, every weekday morning. What moved in Latin American markets, politics and expat life.

Yesterday’s subject line: “US lifts sanctions on Venezuela's Jorge Rodríguez”

Free. We send a confirmation link first — nothing arrives until you click it. Unsubscribe with one click in any edition. If you stop opening us for 30 days we stop sending by ourselves, as we assume the interest is no longer there. See our privacy policy. We never share your email.

While motor vehicle production struggled, other manufacturing areas actually saw a slight increase of 0.3% in output, maintaining stability from the previous month.

Utility production declined by 3.7%, contrasting with the steady performance in mining and energy extraction sectors.
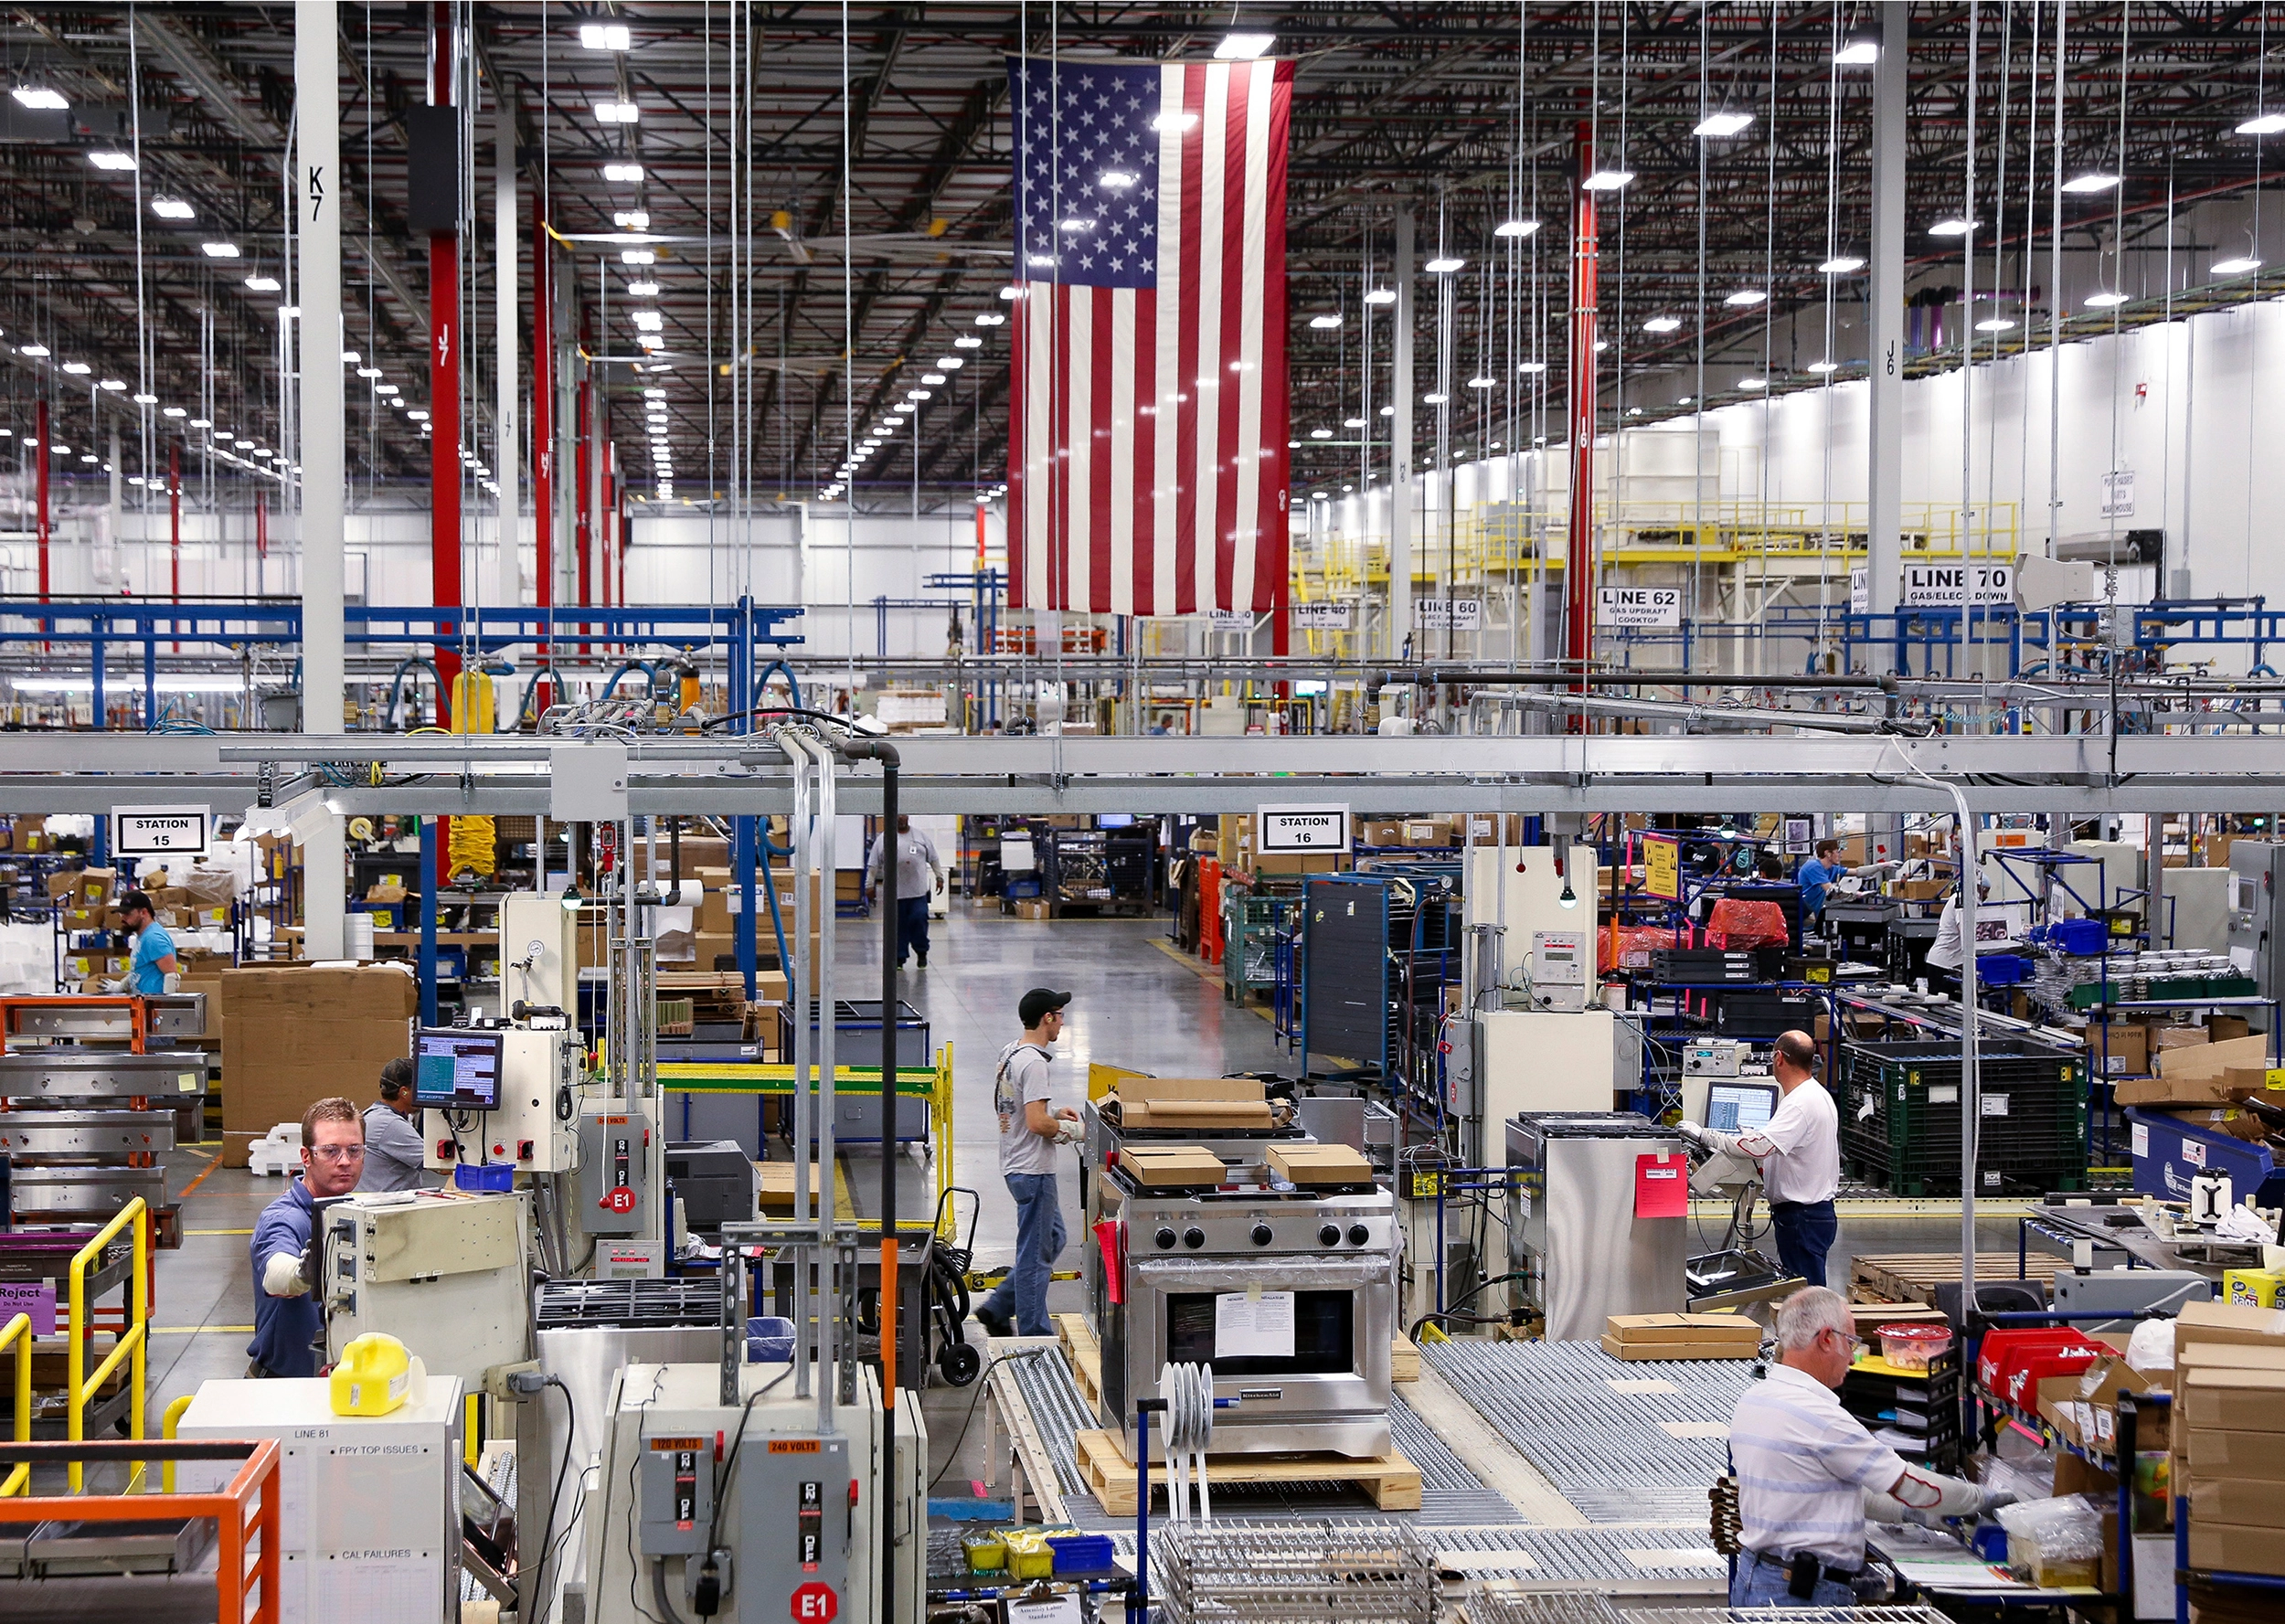
U.S. Industrial Output Marks Steepest Drop Since January.
One-stop reference
Company Intelligence
Every listed company in Latin America — financials, ownership and structure for 1,450+ companies across 26 exchanges, in one place.
Browse the directory →
RT
Ask Rio Times
Latin American markets, currencies and companies.
Open the full Ask Rio Times →

The broader manufacturing sector comprises three-quarters of all industrial output and continues to encounter challenges.

These challenges stem from high interest rates maintained by the Federal Reserve, which reflect a generally pessimistic outlook from industry surveys.

Further data revealed regional manufacturing contractions. New York factories have been shrinking for nine consecutive months, and the Philadelphia Fed region reported its first contraction since January.

The production declines extended beyond manufacturing to energy and chemicals, which dropped by 1.1%. Business equipment and construction supplies also saw decreased production.

Capacity utilization in factories dropped slightly from 77.5% to 77.2%, indicating less efficient use of potential output. The overall industrial utilization followed suit, decreasing to 77.8%.

This report signals significant pressure on the manufacturing sector not only from natural disasters like Hurricane Beryl but also from ongoing economic policies.

These challenges underscore the sector’s vulnerabilities and the need for strategies to bolster resilience and stability in U.S. manufacturing.

Editorial responsibility: Matthias Camenzind, Editor-in-Chief · Editorial standards · Report an error

LatAm Markets: Live Signals → — real-time movers, turnover leaders and FX across Latin America.

Read More from The Rio Times

Rotate for Best Experience

This report is optimized for landscape viewing. Rotate your phone for the full experience.