Precious Metals Find A Floor After Brutal Overnight Liquidation
Key Points
- Gold extended the selloff through February 2, then bounced from a fresh low near $4,665 to about $4,915.
- Silver broke far below the levels that held over the weekend, hit approximately $79.68, then recovered to roughly $86.24.
- The tape still looks mechanical, with forced deleveraging, stop cascades, and thin liquidity driving violent swings.
The crash that began late last week—after gold peaked near $5,040 and silver spiked toward $127—showed no signs of exhaustion through the weekend.
The key question entering Monday was whether the market had finished breaking. The answer came swiftly: not yet, even if prices later found their footing.
February 2: No Relief
Sunday’s session offered no respite. Gold, already reeling from a multi-hundred-dollar drop off its blow-off high, continued to leak lower.

Buyers who stepped in on Friday were underwater by the afternoon. Silver fared worse. The metal that had traded above $100 just days earlier could not hold the $85 level, drifting into the close with an ominous technical setup.
The damage was not just in price. Momentum indicators had rolled over hard. The MACD histograms on both metals turned increasingly negative.
RSI readings that had been pinned in overbought territory above 70 began their descent toward oversold. The structure of the rally was breaking down.
Overnight Into February 3: The Capitulation Low
The real damage occurred in the hours between Sunday evening and early Monday morning. Gold did not simply drift lower—it gapped down at the open, printing $4,669.60 before immediately extending losses to a fresh low of $4,665.25.
That represents a drop of nearly $400 from the January 30 peak, roughly 7.5% in less than a week. Silver’s overnight action was even more brutal.
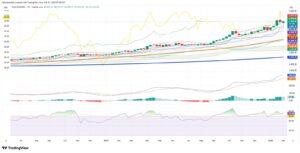
The daily chart shows Monday’s session opened around $79.85, then knifed to $79.68—a level that would have seemed impossible when the metal was flirting with $127 just over a week ago. From peak to trough, silver shed nearly 40% of its value.
The Morning Rebound
By the 07:51 UTC snapshot, both metals had staged sharp recoveries. Gold bounced to $4,914.72, a gain of 5.5% from the session low.
Silver rallied to $86.24, up nearly 9% from its nadir. These are not normal moves. They are the fingerprints of a market in crisis.
The 4-hour charts capture the violence. Gold’s RSI collapsed to 36 before recovering to 47. The MACD histogram shows readings of -92 to -102, deep in negative territory. Silver’s 4-hour RSI hit 33 before bouncing to 41, while its MACD printed -6.4 to -7.1.
What It Means
This is forced liquidation, not fundamental repricing. Once the crowded trade cracked, the market started behaving like a leveraged product.
Stops get hit. Margin calls follow. Volatility controls reduce exposure. Dealers hedge more aggressively as price falls. Each layer accelerates the next.
The rebound does not disprove the flash-crash thesis. It confirms the regime shift. In a liquidation phase, violent bounces are common. They are part of the same process that creates the collapse.
Short-covering rallies can be sharp precisely because the same thin liquidity that enables crashes also enables snapback moves when selling exhausts itself.
The weekly charts offer some perspective. Gold‘s longer-term uptrend from mid-2024 remains intact—price is still well above the 200-period moving average around $2,500.
Silver’s weekly structure shows the metal holding above its own rising trendline, with the recent spike and reversal creating a massive upper wick.
For investors, the risk is now path risk. Even if the long-term story returns—and the fundamental case for precious metals has not changed overnight—the short-term swings can force exits at the worst possible moment.
Until volatility compresses and prices stabilize for more than a few sessions, this market remains hazardous to trade with size.
Related coverage: Brazil’s Morning Call | How Latin America’s Safest Country Lost Its Innocence—And Wh This is part of The Rio Times’ daily coverage of Latin American news and financial markets.
This article was produced by The Rio Times’ automated newsroom system. How we use AI · Report an error · Editorial responsibility: Matthias Camenzind, Editor-in-Chief
Read More from The Rio Times