IBOV 187,770.02 ▲ 1.42% IPSA 11,315.26 ▼ 1.14% IPC MEX 65,010.39 ▲ 0.44% MERVAL 3,067,964 ▲ 1.10% COLCAP 2,573.33 ▲ 0.31% BVL PERÚ 59,620.96 ▲ 0.86% USD/BRL5.09▼ 0.78% USD/MXN16.91▼ 0.03% USD/CLP923.63▼ 1.17% USD/COP3,109▼ 0.62% USD/PEN3.35▼ 0.20% USD/ARS1,512▼ 0.02% USD/UYU40.22▲ 1.23% USD/PYG5,892▲ 0.36% USD/BOB12.45▲ 2.03% USD/DOP58.50▼ 0.01% USD/CRC446.50▲ 1.13% USD/GTQ7.64▲ 2.32% USD/HNL26.84▲ 1.63% USD/NIO36.62▲ 0.69% USD/VES812.65▼ 0.13% USD/PAB1.00— 0.00% USD/BZD2.00— 0.00% USD/JMD 157.28 — 0.00% USD/TTD6.71▲ 1.03% EUR/BRL5.91▼ 0.58% BRENT 88.88 ▼ 0.03% WTI 83.11 ▼ 0.11% IRON ORE 161.91 — — COPPER 6.61 ▲ 0.03% GOLD 4,461 ▲ 1.78% SILVER 65.59 ▲ 1.26% SOY 1,184 ▲ 3.20% CORN 480.50 ▲ 10.02% WHEAT 655.00 ▲ 3.93% COFFEE 317.25 ▼ 5.51% SUGAR 16.43 ▼ 1.79% ORANGE JUICE 138.55 ▼ 0.47% COTTON 85.03 ▲ 2.33% COCOA 5,719 ▲ 3.18% BEEF 223.60 ▼ 3.93% CATTLE 339.10 ▼ 3.16% LITHIUM 75.20 ▲ 1.47% PETR4 41.64 ▼ 0.05% VALE3 72.97 ▲ 0.83% ITUB4 38.60 ▼ 1.03% BBDC4 16.85 ▲ 0.36% ABEV3 14.89 ▼ 0.80% BBAS3 19.37 ▲ 0.47% B3SA3 14.26 ▼ 0.21% WEGE3 47.59 ▲ 0.49% PRIO3 59.14 ▼ 0.19% SUZB3 41.33 ▲ 2.35% RENT3 34.68 ▼ 0.09% AZZA3 15.89 ▼ 2.63% CSAN3 3.22 ▼ 1.83% RAIZ4 0.25 — 0.00% PCAR3 2.75 ▼ 0.36% GMAT3 3.65 ▼ 1.08% PSSA3 48.13 ▼ 0.54% CVCB3 1.33 ▼ 2.92% POSI3 3.36 ▲ 2.44% SLCE3 13.34 ▲ 0.30% NATU3 8.14 ▼ 0.73% IBOV 187,770.02 ▲ 1.42% IPSA 11,315.26 ▼ 1.14% IPC MEX 65,010.39 ▲ 0.44% MERVAL 3,067,964 ▲ 1.10% COLCAP 2,573.33 ▲ 0.31% BVL PERÚ 59,620.96 ▲ 0.86% USD/BRL 5.16 ▲ 0.01% USD/MXN 17.06 ▼ 0.24% USD/CLP 913.98 ▲ 0.04% USD/COP 3,140 ▲ 0.03% USD/PEN 3.36 ▼ 0.66% USD/ARS 1,493 ▲ 0.10% USD/UYU 40.27 ▲ 1.24% USD/PYG 5,939 ▲ 1.68% USD/BOB 11.64 ▼ 0.76% USD/DOP 58.34 ▲ 1.25% USD/CRC 445.92 ▲ 0.89% USD/GTQ 7.62 ▲ 2.21% USD/HNL 26.79 ▲ 1.57% USD/NIO 36.62 ▲ 0.69% USD/VES 762.44 ▼ 0.13% USD/PAB 1.00 — 0.00% USD/BZD 2.00 — 0.00% USD/JMD 157.28 — 0.00% USD/TTD 6.70 ▲ 0.61% EUR/BRL 5.95 ▲ 1.01% BRENT 88.88 ▼ 0.03% WTI 83.11 ▼ 0.11% IRON ORE 161.91 — — COPPER 6.61 ▲ 0.03% GOLD 4,461 ▲ 1.78% SILVER 65.59 ▲ 1.26% SOY 1,184 ▲ 3.20% CORN 480.50 ▲ 10.02% WHEAT 655.00 ▲ 3.93% COFFEE 317.25 ▼ 5.51% SUGAR 16.43 ▼ 1.79% ORANGE JUICE 138.55 ▼ 0.47% COTTON 85.03 ▲ 2.33% COCOA 5,719 ▲ 3.18% BEEF 223.60 ▼ 3.93% CATTLE 339.10 ▼ 3.16% LITHIUM 75.20 ▲ 1.47% PETR4 41.64 ▼ 0.05% VALE3 72.97 ▲ 0.83% ITUB4 38.60 ▼ 1.03% BBDC4 16.85 ▲ 0.36% ABEV3 14.89 ▼ 0.80% BBAS3 19.37 ▲ 0.47% B3SA3 14.26 ▼ 0.21% WEGE3 47.59 ▲ 0.49% PRIO3 59.14 ▼ 0.19% SUZB3 41.33 ▲ 2.35% RENT3 34.68 ▼ 0.09% AZZA3 15.89 ▼ 2.63% CSAN3 3.22 ▼ 1.83% RAIZ4 0.25 — 0.00% PCAR3 2.75 ▼ 0.36% GMAT3 3.65 ▼ 1.08% PSSA3 48.13 ▼ 0.54% CVCB3 1.33 ▼ 2.92% POSI3 3.36 ▲ 2.44% SLCE3 13.34 ▲ 0.30% NATU3 8.14 ▼ 0.73%
since 2009
Tuesday, September 8, 2026

Brazil Business - Brazil

Petrobras’s 2026–2030 Plan Faces A Hard Choice As Brent Slips Toward $60

By · October 13, 2025 · 2 min read

The LatAm Brief

One email, every weekday morning. What moved in Latin American markets, politics and expat life.

Yesterday’s subject line: “227 dead in Latin American waters. Yesterday, none.”

Free. We send a confirmation link first — nothing arrives until you click it. Unsubscribe with one click in any edition. If you stop opening us for 30 days we stop sending by ourselves, as we assume the interest is no longer there. See our privacy policy. We never share your email.

Brazil’s oil giant is redrafting its 2026–2030 plan under very different math. The previous blueprint assumed roughly $80 Brent and mapped $111 billion in spending.

With oil hovering in the low-$60s, Petrobras now faces a simple but stark choice: delay or trim projects—or borrow more—just as the 2026 election season gathers pace.

Inside the company, the compass points to discipline over debt. Executives are working to keep three pillars intact: a self-funded plan, a gross-debt ceiling of $75 billion, and the dividend framework.

That likely means a smaller capital envelope—around $100 billion—paired with explicit cost cuts, while prioritizing high-return pre-salt fields and phasing lower-priority items rather than canceling them.

Two buffers buy time. First, production is rising as new pre-salt platforms ramp, lifting output toward roughly 2.8–2.9 million barrels of oil equivalent per day.

Second, lifting costs near $6 per barrel of oil equivalent keep many projects profitable even at today’s prices. Together, they help protect the balance sheet and a baseline dividend—though special distributions look less likely if crude stays subdued.
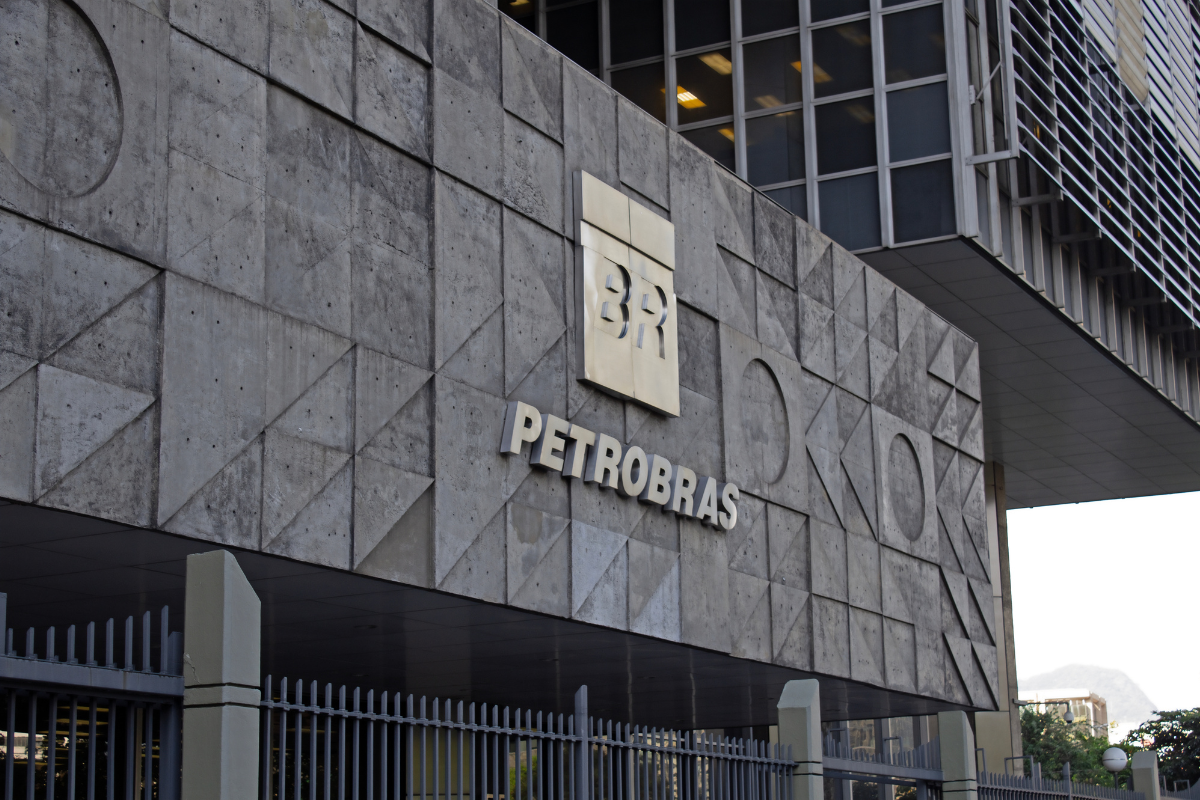
Petrobras’s 2026–2030 Plan Faces A Hard Choice As Brent Slips Toward $60.
RT
Ask Rio Times
Latin American markets, currencies and companies.
Open the full Ask Rio Times →

Petrobras Balances Politics, Prices, and Pressure

The story behind the story is politics and pocketbooks. In an election year, governments rarely scrap flagship industrial projects; they re-sequence them and spotlight investments with visible local benefits.

That’s why Brazil-facing moves—such as R$2.6 billion ($491 million) in Bahia tied to shipyards and fertilizer capacity—are more likely to survive belt-tightening. Cheaper oil can also soften pump prices and farm-input costs, even as it squeezes Petrobras’s cash generation.

The gap is big: if average prices come in $15 per barrel lower than the prior assumption over five years, company revenue could be roughly R$362 billion ($68.3 billion) lighter. That estimate explains the emphasis on phasing, cost control, and sticking to the $75 billion debt cap.

What to watch next: board approval of the 2026–2030 plan; whether capex lands near $100 billion with named savings; the pace of pre-salt ramp-ups and unit costs; and year-end dividend signals.

For investors, consumers, and taxpayers alike, the question is whether Brazil’s flagship producer can stay resilient when the price of its core commodity is not.

Live Company IntelligencePetroleo Brasileiro Petrobras SA ADR — the full investor dossierInside: live share price, market cap, three-year financials, valuation, ESG and peer benchmarks — plus the latest Rio Times coverage.
P
◆ Live Company Intelligence
Petroleo Brasileiro Petrobras
NYSE: PBRPETR4EnergyOil & Gas Integrated43,199 employees
$129.66B
Market cap
Analyst target $22.10

Wall Street view

4.4Buy/ 5
11 Buy3 Hold0 Sell
Avg. price target $22.10  ·  +29% vs 200-day

Valuation & profitability

Market cap$129.66B
Revenue (TTM)$548.49B
P / E ratio5.1
Profit margin24.3%
Return on equity30.3%

Price & risk

52-wk low
$10.65
52-wk high
$21.44
Beta (volatility)-0.21
200-day average$17.07

Revenue trend · 6y

20202025
Latest $88.10B

Ownership

Institutions22.3%
Shares outstanding3.72B
Top holderGQG Partners LLC
Institutional holders5+ funds

Dividend

Yield17.9%
Payout ratio28.3%
Fwd. annual$1.68
What Petroleo Brasileiro Petrobras does. Petróleo Brasileiro S.A. – Petrobras explores, produces, and sells oil and gas in Brazil, China, the United States, the Americas, Asia, Europe, Singapore, and internationally. It operates through three segments: Exploration and Production; Refining, Transportation & Marketing; and Gas & Low Carbon Energies. The Exploration and Production segment explores, develops, and produces…
Data: RT fundamentals (PBR.US) · figures in USD · as of 8 Sep 2026More company intelligence →

This article was produced by The Rio Times’ automated newsroom system. How we use AI · Report an error

LatAm Markets: Live Signals → — real-time movers, turnover leaders and FX across Latin America.

Read More from The Rio Times

The Rio Times · Power Map
See who really holds power in Latin America
Click to open the Power Map

Rotate for Best Experience

This report is optimized for landscape viewing. Rotate your phone for the full experience.