IBOV 172,513.42 ▼ 1.73% IPSA 11,256.28 ▼ 0.17% IPC MEX 66,938.64 ▲ 0.82% MERVAL 3,086,785 ▼ 0.45% COLCAP 2,350.44 — 0.00% BVL PERÚ 59,143.04 ▲ 0.74% USD/BRL5.09▲ 0.07% USD/MXN17.14▲ 0.04% USD/CLP 912.03 — 0.00% USD/COP3,156▲ 0.02% USD/PEN3.38▼ 0.28% USD/ARS1,499▼ 0.03% USD/UYU40.27— 0.00% USD/PYG5,920— 0.00% USD/BOB11.78— 0.00% USD/DOP58.11— 0.00% USD/CRC450.33— 0.00% USD/GTQ7.62— 0.00% USD/HNL26.78— 0.00% USD/NIO 36.62 — 0.00% USD/VES755.65▼ 0.13% USD/PAB1.00— 0.00% USD/BZD2.00— 0.00% USD/JMD157.89▲ 0.36% USD/TTD6.73— 0.00% EUR/BRL5.88▲ 0.01% BRENT 83.55 ▲ 1.29% WTI 78.18 ▲ 1.15% IRON ORE 161.91 — — COPPER 6.59 ▼ 1.44% GOLD 4,400 ▲ 3.72% SILVER 63.50 ▲ 3.35% SOY 1,176 ▲ 1.64% CORN 461.50 ▲ 5.13% WHEAT 639.75 ▲ 1.35% COFFEE 313.65 ▼ 2.49% SUGAR 16.49 ▲ 5.91% ORANGE JUICE 147.00 ▼ 2.91% COTTON 84.07 ▲ 2.57% COCOA 5,847 ▲ 1.23% BEEF 225.28 ▼ 2.57% CATTLE 345.23 ▼ 0.81% LITHIUM 74.01 ▲ 2.21% PETR4 40.87 ▼ 2.99% VALE3 74.97 ▼ 0.56% ITUB4 40.75 ▼ 2.58% BBDC4 17.31 ▼ 2.20% ABEV3 15.48 ▼ 1.15% BBAS3 20.06 ▼ 1.08% B3SA3 14.95 ▼ 2.67% WEGE3 48.12 ▼ 0.58% PRIO3 57.45 ▼ 1.98% SUZB3 41.70 ▼ 0.64% RENT3 37.82 ▼ 0.89% AZZA3 17.01 ▲ 5.06% CSAN3 3.67 ▼ 3.17% RAIZ4 0.26 — 0.00% PCAR3 2.92 ▲ 0.69% GMAT3 3.73 ▼ 2.36% PSSA3 50.42 ▼ 4.24% CVCB3 1.52 ▲ 0.66% POSI3 3.53 ▲ 1.44% SLCE3 13.22 ▲ 0.08% NATU3 8.28 ▲ 1.22% BRKM5 5.94 ▼ 1.82% RANI3 8.26 ▼ 0.60% CSNA3 4.57 ▼ 3.59% CMIN3 5.45 ▼ 5.22% USIM5 7.15 ▼ 0.56% GGBR4 25.05 ▼ 2.34% ENEV3 26.18 ▼ 1.58% CPFE3 44.80 ▼ 2.29% CMIG4 10.92 ▼ 1.71% EQTL3 37.28 ▼ 2.99% LREN3 12.39 ▼ 8.09% VIVT3 30.58 ▼ 1.00% RAIL3 13.59 ▼ 0.88% KLABIN 18.01 ▼ 0.06% RAIA DROGASIL 20.22 ▲ 0.50% RDOR3 33.92 ▼ 0.41% HAPV3 10.77 ▼ 3.23% FLRY3 18.95 ▲ 9.73% SMTO3 14.77 ▲ 0.54% UGPA3 31.28 ▼ 4.49% VBBR3 34.23 ▼ 2.34% BBSE3 38.38 ▼ 6.30% BPAC11 53.91 ▼ 4.07% CURY3 31.36 ▼ 0.54% AERI3 2.29 — 0.00% VIVARA 21.63 ▼ 0.83% COMPASS 22.83 ▼ 2.10% VAMOS 3.08 ▼ 0.96% SANB11 29.27 — 0.00% ASAI3 8.24 ▼ 2.94% SBSP3 26.89 ▼ 1.83% WALMEX 49.60 ▲ 1.25% GMEXICO 225.45 ▲ 2.56% FEMSA 209.34 ▼ 0.19% CEMEX 19.48 ▼ 0.20% GFNORTE 199.41 ▲ 0.28% BIMBO 61.21 ▲ 0.67% TELEVISA 9.77 ▲ 0.10% AMX 20.41 ▼ 0.97% GAP 382.39 ▲ 0.06% ASUR 276.68 ▼ 0.34% OMA 236.74 ▼ 0.63% KOF 189.00 ▲ 0.55% GRUMA 254.51 ▲ 0.38% KIMBER 40.73 ▲ 1.29% SQM-B 65,789 ▼ 0.77% COPEC 6,115 ▼ 1.37% BSANTANDER 80.16 ▼ 1.11% FALABELLA 6,470 ▲ 1.09% ENELAM 87.40 ▼ 0.24% CENCOSUD 2,050 ▼ 0.49% CMPC 1,030 — 0.00% BANCO CHILE 188.65 ▼ 1.59% LATAM AIR 25.80 ▼ 2.09% YPF 7,775 ▼ 0.77% GGAL 7,315 ▼ 0.81% PAMPA 5,205 ▲ 0.39% TXAR 723.00 ▲ 6.40% ALUAR 934.50 ▼ 0.16% TGS 9,135 ▼ 0.76% CEPU 2,208 ▲ 1.42% MIRGOR 1,630 ▲ 0.31% COME 41.31 ▲ 0.32% LOMA NEGRA 3,283 ▼ 2.88% BYMA 290.00 ▲ 0.17% TELECOM ARG 4,380 ▲ 0.86% ECOPETROL 16.78 ▼ 3.56% BANCOLOMBIA 88.85 ▼ 1.55% GRUPO AVAL 5.06 ▼ 0.98% CREDICORP 386.93 ▼ 1.44% SOUTHERN COPPER 199.06 ▲ 3.12% BUENAVENTURA 34.15 ▲ 4.88% MERCADOLIBRE 1,821 ▼ 0.51% NUBANK 13.84 ▼ 1.98% XP 16.24 ▼ 2.64% PAGSEGURO 9.14 ▼ 2.35% STONE 10.60 ▼ 4.33% GLOBANT 37.37 ▲ 0.32% TECNOGLASS 44.14 ▼ 0.74% GAP AIRPORT 222.70 ▲ 0.27% ASUR 276.68 ▼ 0.34% OMA AIRPORT 110.44 ▼ 0.69% AMX ADR 23.75 ▼ 0.71% FEMSA ADR 122.46 ▲ 0.23% CEMEX ADR 11.33 ▲ 0.27% PETROBRAS ADR 17.96 ▼ 3.02% VALE ADR 14.71 ▼ 0.07% ITAU ADR 7.94 ▼ 2.93% SANTANDER BR 5.81 ▲ 0.26% AMBEV ADR 3.00 ▼ 0.33% CSN 0.93 ▼ 1.60% GERDAU 4.95 ▼ 1.79% LATAM ADR 56.72 ▼ 1.27% BTC 64,921 ▲ 0.02% ETH 1,919 ▲ 0.21% SOL 76.36 ▲ 0.51% XRP 1.04 ▼ 0.27% BNB 603.98 ▲ 0.59% ADA 0.20 ▼ 1.55% DOGE 0.07 ▼ 0.36% AVAX 6.47 ▼ 0.05% LINK 8.30 ▼ 0.03% DOT 0.81 ▼ 0.95% LTC 46.12 ▲ 0.30% BCH 216.40 ▲ 0.20% TRX 0.33 ▲ 0.16% XLM 0.16 ▼ 1.05% HBAR 0.07 ▼ 0.25% NEAR 1.61 ▲ 0.05% ATOM 1.38 ▼ 0.49% AAVE 91.04 ▼ 0.21% SELIC 14.00% EMBRAER 92.52 ▲ 0.95% EMBRAER ADR 73.01 ▲ 1.50% JBS 14.23 ▲ 3.94% JBS BDR 72.09 ▲ 3.13% MBRF3 16.07 ▼ 2.37% MBRFY 3.12 ▼ 3.70% INTER 5.27 ▼ 7.87% EGX 54,980 ▲ 0.59% USD/ZAR16.16▲ 0.10% USD/NGN1,362▲ 0.09% NIKKEI 65,607 ▼ 0.12% CSI300 4,694 ▲ 0.93% HSI 25,668 ▲ 0.54% NIFTY 24,571 ▼ 0.27% KOSPI 6,259 ▼ 0.60% JCI 6,410 ▲ 1.04% USD/JPY158.38▲ 0.44% USD/CNY6.74▼ 0.06% DAX 26,319 ▲ 0.69% CAC 8,715 ▲ 0.17% FTSE 10,901 ▲ 0.31% MIB 53,717 ▲ 0.06% IBEX 20,176 ▼ 0.02% STOXX 660.25 ▲ 0.31% EUR/USD1.16▼ 0.03% GBP/USD1.35▲ 0.01% SPX 7,758 ▲ 0.62% DJI 54,037 ▲ 0.28% NDX 29,722 ▲ 1.19% RUT 3,034 ▲ 1.10% TSX 36,381 ▲ 0.68% VIX 14.90 ▼ 1.65% USD/CAD1.40▲ 0.05% US10Y 4.6600 ▼ 0.21% IBOV 172,513.42 ▼ 1.73% IPSA 11,256.28 ▼ 0.17% IPC MEX 66,938.64 ▲ 0.82% MERVAL 3,086,785 ▼ 0.45% COLCAP 2,350.44 — 0.00% BVL PERÚ 59,143.04 ▲ 0.74% USD/BRL 5.08 ▲ 0.03% USD/MXN 17.12 ▼ 0.62% USD/CLP 912.03 — 0.00% USD/COP 3,153 ▼ 0.89% USD/PEN 3.38 ▲ 0.08% USD/ARS 1,499 ▼ 0.08% USD/UYU 40.27 ▲ 1.51% USD/PYG 5,920 ▲ 1.24% USD/BOB 11.78 ▼ 1.55% USD/DOP 58.11 ▲ 0.19% USD/CRC 450.33 ▲ 2.09% USD/GTQ 7.62 ▲ 2.32% USD/HNL 26.78 ▲ 0.65% USD/NIO 36.62 — 0.00% USD/VES 754.82 ▼ 0.13% USD/PAB 1.00 — 0.00% USD/BZD 2.00 — 0.00% USD/JMD 157.89 ▲ 0.62% USD/TTD 6.73 ▲ 1.38% EUR/BRL 5.87 ▼ 0.97% BRENT 83.55 ▲ 1.29% WTI 78.18 ▲ 1.15% IRON ORE 161.91 — — COPPER 6.59 ▼ 1.44% GOLD 4,400 ▲ 3.72% SILVER 63.50 ▲ 3.35% SOY 1,176 ▲ 1.64% CORN 461.50 ▲ 5.13% WHEAT 639.75 ▲ 1.35% COFFEE 313.65 ▼ 2.49% SUGAR 16.49 ▲ 5.91% ORANGE JUICE 147.00 ▼ 2.91% COTTON 84.07 ▲ 2.57% COCOA 5,847 ▲ 1.23% BEEF 225.28 ▼ 2.57% CATTLE 345.23 ▼ 0.81% LITHIUM 74.01 ▲ 2.21% PETR4 40.87 ▼ 2.99% VALE3 74.97 ▼ 0.56% ITUB4 40.75 ▼ 2.58% BBDC4 17.31 ▼ 2.20% ABEV3 15.48 ▼ 1.15% BBAS3 20.06 ▼ 1.08% B3SA3 14.95 ▼ 2.67% WEGE3 48.12 ▼ 0.58% PRIO3 57.45 ▼ 1.98% SUZB3 41.70 ▼ 0.64% RENT3 37.82 ▼ 0.89% AZZA3 17.01 ▲ 5.06% CSAN3 3.67 ▼ 3.17% RAIZ4 0.26 — 0.00% PCAR3 2.92 ▲ 0.69% GMAT3 3.73 ▼ 2.36% PSSA3 50.42 ▼ 4.24% CVCB3 1.52 ▲ 0.66% POSI3 3.53 ▲ 1.44% SLCE3 13.22 ▲ 0.08% NATU3 8.28 ▲ 1.22% BRKM5 5.94 ▼ 1.82% RANI3 8.26 ▼ 0.60% CSNA3 4.57 ▼ 3.59% CMIN3 5.45 ▼ 5.22% USIM5 7.15 ▼ 0.56% GGBR4 25.05 ▼ 2.34% ENEV3 26.18 ▼ 1.58% CPFE3 44.80 ▼ 2.29% CMIG4 10.92 ▼ 1.71% EQTL3 37.28 ▼ 2.99% LREN3 12.39 ▼ 8.09% VIVT3 30.58 ▼ 1.00% RAIL3 13.59 ▼ 0.88% KLABIN 18.01 ▼ 0.06% RAIA DROGASIL 20.22 ▲ 0.50% RDOR3 33.92 ▼ 0.41% HAPV3 10.77 ▼ 3.23% FLRY3 18.95 ▲ 9.73% SMTO3 14.77 ▲ 0.54% UGPA3 31.28 ▼ 4.49% VBBR3 34.23 ▼ 2.34% BBSE3 38.38 ▼ 6.30% BPAC11 53.91 ▼ 4.07% CURY3 31.36 ▼ 0.54% AERI3 2.29 — 0.00% VIVARA 21.63 ▼ 0.83% COMPASS 22.83 ▼ 2.10% VAMOS 3.08 ▼ 0.96% SANB11 29.27 — 0.00% ASAI3 8.24 ▼ 2.94% SBSP3 26.89 ▼ 1.83% WALMEX 49.60 ▲ 1.25% GMEXICO 225.45 ▲ 2.56% FEMSA 209.34 ▼ 0.19% CEMEX 19.48 ▼ 0.20% GFNORTE 199.41 ▲ 0.28% BIMBO 61.21 ▲ 0.67% TELEVISA 9.77 ▲ 0.10% AMX 20.41 ▼ 0.97% GAP 382.39 ▲ 0.06% ASUR 276.68 ▼ 0.34% OMA 236.74 ▼ 0.63% KOF 189.00 ▲ 0.55% GRUMA 254.51 ▲ 0.38% KIMBER 40.73 ▲ 1.29% SQM-B 65,789 ▼ 0.77% COPEC 6,115 ▼ 1.37% BSANTANDER 80.16 ▼ 1.11% FALABELLA 6,470 ▲ 1.09% ENELAM 87.40 ▼ 0.24% CENCOSUD 2,050 ▼ 0.49% CMPC 1,030 — 0.00% BANCO CHILE 188.65 ▼ 1.59% LATAM AIR 25.80 ▼ 2.09% YPF 7,775 ▼ 0.77% GGAL 7,315 ▼ 0.81% PAMPA 5,205 ▲ 0.39% TXAR 723.00 ▲ 6.40% ALUAR 934.50 ▼ 0.16% TGS 9,135 ▼ 0.76% CEPU 2,208 ▲ 1.42% MIRGOR 1,630 ▲ 0.31% COME 41.31 ▲ 0.32% LOMA NEGRA 3,283 ▼ 2.88% BYMA 290.00 ▲ 0.17% TELECOM ARG 4,380 ▲ 0.86% ECOPETROL 16.78 ▼ 3.56% BANCOLOMBIA 88.85 ▼ 1.55% GRUPO AVAL 5.06 ▼ 0.98% CREDICORP 386.93 ▼ 1.44% SOUTHERN COPPER 199.06 ▲ 3.12% BUENAVENTURA 34.15 ▲ 4.88% MERCADOLIBRE 1,821 ▼ 0.51% NUBANK 13.84 ▼ 1.98% XP 16.24 ▼ 2.64% PAGSEGURO 9.14 ▼ 2.35% STONE 10.60 ▼ 4.33% GLOBANT 37.37 ▲ 0.32% TECNOGLASS 44.14 ▼ 0.74% GAP AIRPORT 222.70 ▲ 0.27% ASUR 276.68 ▼ 0.34% OMA AIRPORT 110.44 ▼ 0.69% AMX ADR 23.75 ▼ 0.71% FEMSA ADR 122.46 ▲ 0.23% CEMEX ADR 11.33 ▲ 0.27% PETROBRAS ADR 17.96 ▼ 3.02% VALE ADR 14.71 ▼ 0.07% ITAU ADR 7.94 ▼ 2.93% SANTANDER BR 5.81 ▲ 0.26% AMBEV ADR 3.00 ▼ 0.33% CSN 0.93 ▼ 1.60% GERDAU 4.95 ▼ 1.79% LATAM ADR 56.72 ▼ 1.27% BTC 64,921 ▲ 0.02% ETH 1,919 ▲ 0.21% SOL 76.36 ▲ 0.51% XRP 1.04 ▼ 0.27% BNB 603.98 ▲ 0.59% ADA 0.20 ▼ 1.55% DOGE 0.07 ▼ 0.36% AVAX 6.47 ▼ 0.05% LINK 8.30 ▼ 0.03% DOT 0.81 ▼ 0.95% LTC 46.12 ▲ 0.30% BCH 216.40 ▲ 0.20% TRX 0.33 ▲ 0.16% XLM 0.16 ▼ 1.05% HBAR 0.07 ▼ 0.25% NEAR 1.61 ▲ 0.05% ATOM 1.38 ▼ 0.49% AAVE 91.04 ▼ 0.21% SELIC 14.00% EMBRAER 92.52 ▲ 0.95% EMBRAER ADR 73.01 ▲ 1.50% JBS 14.23 ▲ 3.94% JBS BDR 72.09 ▲ 3.13% MBRF3 16.07 ▼ 2.37% MBRFY 3.12 ▼ 3.70% INTER 5.27 ▼ 7.87% EGX 54,980 ▲ 0.59% USD/ZAR 16.13 ▼ 1.25% USD/NGN 1,362 ▲ 0.08% NIKKEI 65,607 ▼ 0.12% CSI300 4,694 ▲ 0.93% HSI 25,668 ▲ 0.54% NIFTY 24,571 ▼ 0.27% KOSPI 6,259 ▼ 0.60% JCI 6,410 ▲ 1.04% USD/JPY 157.75 ▼ 0.44% USD/CNY 6.7482 ▲ 0.08% DAX 26,319 ▲ 0.69% CAC 8,715 ▲ 0.17% FTSE 10,901 ▲ 0.31% MIB 53,717 ▲ 0.06% IBEX 20,176 ▼ 0.02% STOXX 660.25 ▲ 0.31% EUR/USD 1.1562 ▲ 0.32% GBP/USD 1.3492 ▲ 0.33% SPX 7,758 ▲ 0.62% DJI 54,037 ▲ 0.28% NDX 29,722 ▲ 1.19% RUT 3,034 ▲ 1.10% TSX 36,381 ▲ 0.68% VIX 14.90 ▼ 1.65% USD/CAD 1.3938 ▼ 0.54% US10Y 4.6600 ▼ 0.21%
since 2009
Monday, August 10, 2026

Markets Uncategorized

Oil Falls Despite Hormuz Shock; Petrobras Drops 3%

By · August 10, 2026 · 8 min read

Daily Brief

The morning intel from across Latin America. Free.

By subscribing you agree to our privacy policy. We never share your email.

Key Facts

  • WTI crude, tracked by the USO fund, settled at US$117.98 on Friday, slipping 0.75% as traders looked past the closure of the Strait of Hormuz towards a potential peace deal.
  • Petrobras shares dropped 3.02% to US$17.96, the steepest decline among the region’s majors, hit by the global bearish tilt and the drag from a stronger U.S. dollar.
  • Colombia’s Ecopetrol fell 3.56% to US$16.78, pacing the sector’s losses as the bearish macro mood outweighed record American crude production helping to plug the supply gap.
  • Argentina’s YPF lost 0.91% to US$49.16, showing relative strength as the Vaca Muerta shale play distances itself from offshore geopolitical risk.
  • Oil traders remained broadly bearish despite the expansion of conflict to the Red Sea, with Brent briefly sinking below US$80 a barrel earlier last week on bets of a quick ceasefire.
  • The Trump administration is weighing another suspension of the Jones Act, hoping to lower domestic gasoline prices that remain above US$4 a gallon ahead of midterm elections.

Today’s Focus

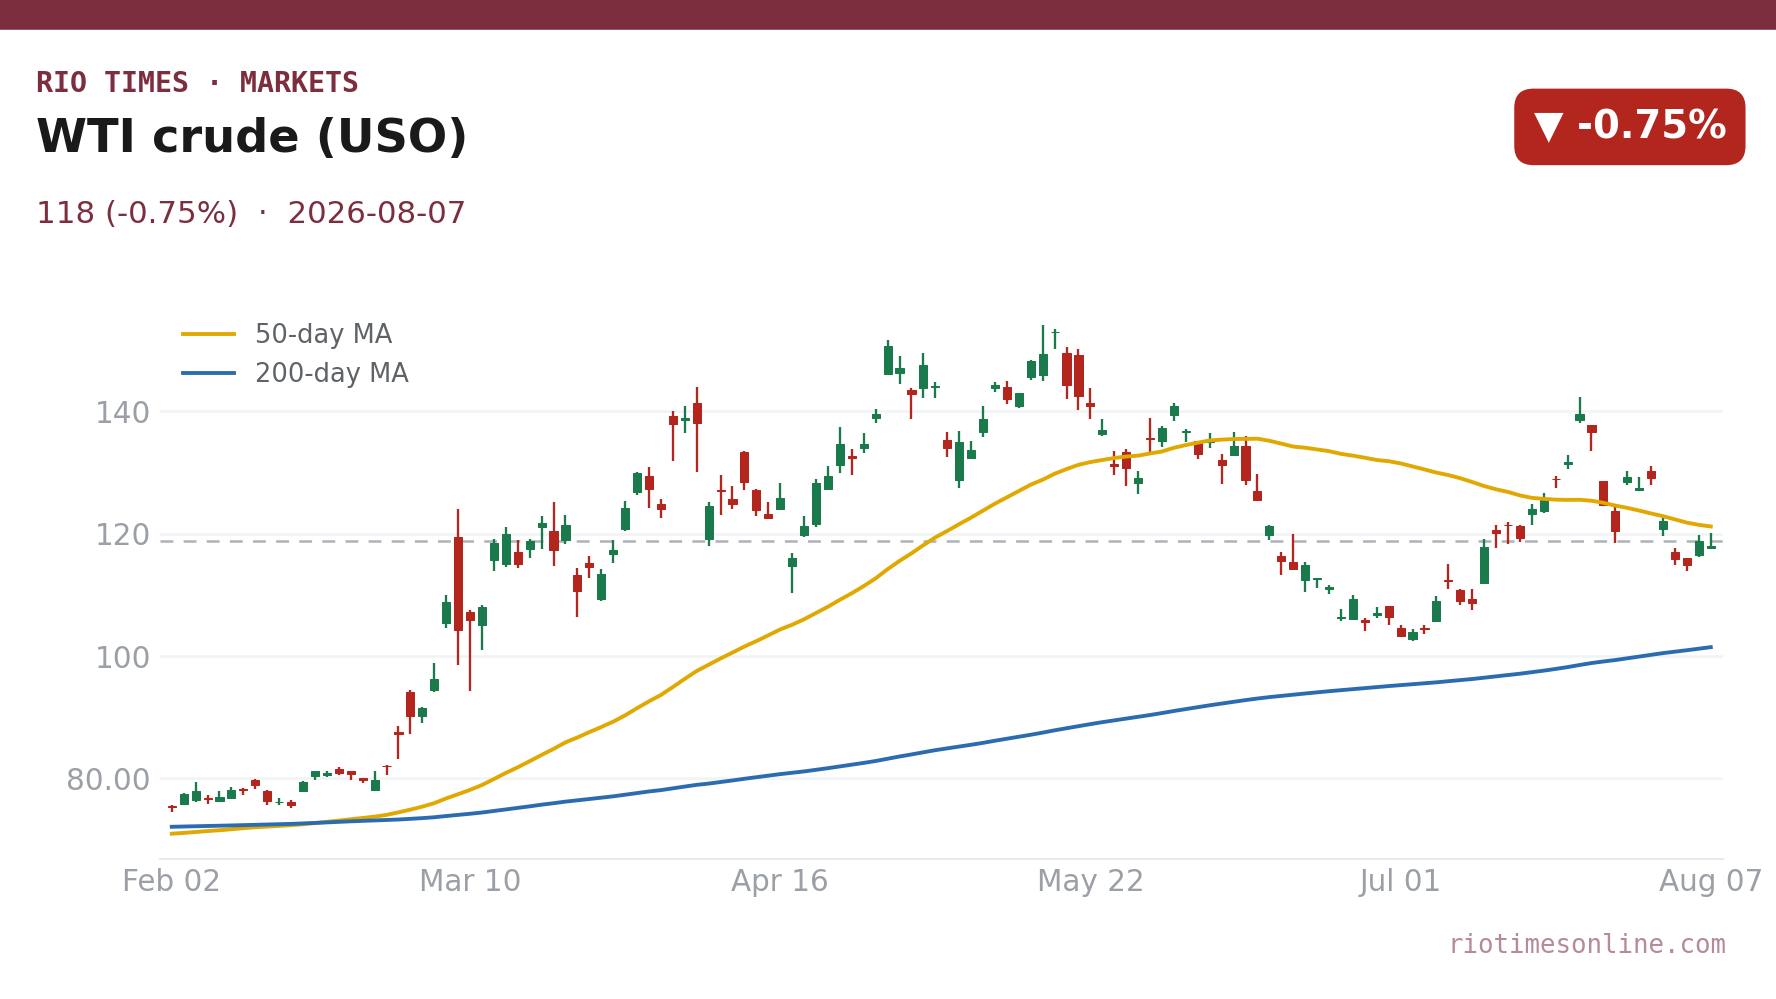
Oil prices fell on Friday, August 7, 2026, driven by a stubbornly bearish trading consensus that expects a swift diplomatic resolution to the Middle Eastern conflict that has sealed off the Strait of Hormuz. The U.S. oil fund USO, which tracks WTI crude, settled at US$117.98, down 0.75% on the day.

The decline weighed heavily on Latin America’s state-controlled producers. Brazil’s Petrobras slumped 3.02% to US$17.96, Colombia’s Ecopetrol dropped 3.56% to US$16.78, and Argentina’s YPF gave back 0.91% to close at US$49.16.

The bearish sentiment persisted even as shipping lanes in the Red Sea remained active war zones and the Jones Act waiver debate signalled political unease over sustained high pump prices. Record U.S. crude volumes have cushioned the global supply shock, but the region’s oil equities are failing to decouple from the downward macro momentum.

What matters today. The market is pricing a peace premium rather than a war premium, and Latin America’s oil stocks are following global sentiment lower despite tight physical supply.

A crude oil tanker docked at a Latin American export terminal.
Oil — the daily wrap. (Photo: Internet Reproduction)
WTI crude (USO) daily chart

01 The session in one read

Crude prices slipped Friday, August 7, 2026. The slide extended a week-long decline that puzzled observers.

The Middle Eastern conflict was expanding, yet traders held firm. They believe a diplomatic breakthrough is near.

The WTI-tracking USO fund settled at US$117.98. That marked a 0.75% daily decline.

The drop hit Latin America’s oil producers hard. A stronger U.S. dollar and deeper risk-off mood fueled the rout.

Petrobras led with a 3.02% fall to US$17.96. Ecopetrol tumbled 3.56% to US$16.78.

YPF slipped a modest 0.91% to US$49.16.

Assessment — Bearish bets defy physical supply risks MEDIUM

O

i

l

e

q

u

i

t

i

e

s

a

r

e

t

r

a

d

i

n

g

a

s

i

f

t

h

e

S

t

r

a

i

t

o

f

H

o

r

m

u

z

h

a

s

a

l

r

e

a

d

y

r

e

o

p

e

n

e

d

,

a

s

c

e

n

a

r

i

o

t

h

a

t

l

e

a

v

e

s

t

h

e

m

v

u

l

n

e

r

a

b

l

e

t

o

a

v

i

o

l

e

n

t

r

e

p

r

i

c

i

n

g

i

f

p

e

a

c

e

t

a

l

k

s

f

a

i

l

.

W

h

i

l

e

A

m

e

r

i

c

a

n

p

r

o

d

u

c

t

i

o

n

r

e

c

o

r

d

s

a

r

e

h

e

l

p

i

n

g

r

e

f

i

n

e

r

s

r

e

p

l

a

c

e

l

o

s

t

M

i

d

d

l

e

E

a

s

t

e

r

n

b

a

r

r

e

l

s

,

t

h

e

p

a

p

e

r

m

a

r

k

e

t

h

a

s

d

e

t

a

c

h

e

d

f

r

o

m

t

h

e

p

h

y

s

i

c

a

l

r

e

a

l

i

t

y

o

f

d

i

s

r

u

p

t

e

d

s

u

p

p

l

y

c

h

a

i

n

s

.

T

h

e

v

a

r

i

a

b

l

e

t

o

w

a

t

c

h

i

s

w

h

e

t

h

e

r

B

r

e

n

t

c

r

u

d

e

,

w

h

i

c

h

b

r

i

e

f

l

y

d

i

p

p

e

d

b

e

l

o

w

U

S

US$8

0

a

b

a

r

r

e

l

l

a

s

t

w

e

e

k

,

c

a

n

r

e

c

l

a

i

m

t

h

a

t

l

e

v

e

l

a

s

a

f

l

o

o

r

i

f

c

e

a

s

e

f

i

r

e

n

e

g

o

t

i

a

t

i

o

n

s

s

t

a

l

l

.

02 The board

Every major Latin American oil proxy on our board finished in the red. The heaviest blows landed on Caribbean-facing drillers.

Petrobras at US$17.96 and Ecopetrol at US$16.78 each lost more than 3%. They moved in lockstep with a flattened futures curve despite the Strait of Hormuz supply crisis.

Argentina’s YPF was the session’s resilient outlier. It eased just 0.91% to US$49.16.

Foreign investors now view the Vaca Muerta-adjacent stock as a landlocked oil story. This insulates it from maritime choke points.

That distinction gives YPF defensive status in a jittery market.

Asset Level Change
WTI crude (USO) US$117.98 -0.75%
Petrobras US$17.96 -3.02%
Ecopetrol US$16.78 -3.56%
YPF US$49.16 -0.91%

Source: RT close, 2026-08-07. Where a commodity has no spot feed, an exchange-traded tracker or leading producer is shown as a labelled proxy.

Live Market IntelligenceThe live market boardInside: market breadth, the sector heatmap, currencies & rates, the Latin America scoreboard and the full instrument board.

Rio Times · Live Market Intelligence

Latin America — Cross-Market Board

Regional
Aug 10, 2026 · 04:03
Ibovespa · benchmark
172,513.42 -1.73%
L 172,131day rangeH 176,117
+26.36% over 12 months
Market breadth · 4 names
50% advancing
2 ▲ advancing2 declining ▼
Currencies, rates & key inputs
USD / BRL
5.08
+0.03%
USD / MXN
17.12
-0.62%
USD / CLP
912.03
+0.00%
USD / COP
3,153
-0.89%
USD / ARS
1,499
-0.08%
Latin America scoreboard
IndexLastTodayStrength
IbovespaBrazil 172,513.42 -1.73%
S&P/BMV IPCMexico 66,938.64 +0.82%
S&P IPSAChile 11,256.28 -0.17%
S&P MERVALArgentina 3,086,785 -0.45%
MSCI COLCAPColombia 2,350.44 +0.00%
BVL S&P PerúPeru 59,143.04 +0.74%
Full instrument board
InstrumentLastChangeYoYPrev.HighLowVolume
IBOV 172,513.42 -1.73% +26.36% 175,546.36 176,117 172,131
IPSA 11,256.28 -0.17% 11,275.15 11,333 11,231 1,513,213,483
IPC MEX 66,938.64 +0.82% +14.89% 66,396.15 67,186 66,395 113,357,974
MERVAL 3,086,785 -0.45% +31.41% 3,100,732 3,149,199 3,055,275
COLCAP 2,350.44 +0.00% 9.04 9.05 9.02 4,133
BVL PERÚ 59,143.04 +0.74%
USD/BRL 5.08 +0.03% -6.86% 5.08 5.08 5.08
EUR/BRL 5.87 -0.97% -7.67% 5.93 5.89 5.87
USD/MXN 17.12 -0.62% -7.99% 17.22 17.22 17.09
USD/CLP 912.03 +0.00% -6.40% 912.03 912.03 912.03
USD/COP 3,153 -0.89% -22.03% 3,181 3,159 3,148
USD/PEN 3.38 +0.08% -4.83% 3.38 3.39 3.37
USD/ARS 1,499 -0.08% +12.54% 1,500 1,500 1,490
USD/UYU 40.27 +1.51% +1.66% 39.67 40.27 40.24
USD/PYG 5,920 +1.24% -19.75% 5,848 5,920 5,919
USD/BOB 11.78 -1.55% +74.45% 11.97 11.81 11.76
USD/DOP 58.11 +0.19% -4.35% 58.00 58.23 57.93
USD/CRC 450.33 +2.09% -8.89% 441.11 450.33 449.15
Largest moves today
USD/CRC 450.33 +2.09%
IBOV 172,513.42 -1.73%
USD/BOB 11.78 -1.55%
USD/UYU 40.27 +1.51%
USD/PYG 5,920 +1.24%
EUR/BRL 5.87 -0.97%
USD/COP 3,153 -0.89%
IPC MEX 66,938.64 +0.82%
The session read
The Ibovespa eased 1.73%, with breadth evenly split — 2 of 4 names higher. IPC MEX led, while MERVAL lagged.
Live Company IntelligencePetroleo Brasileiro Petrobras SA ADR — the full investor dossierInside: live share price, market cap, three-year financials, valuation, ESG and peer benchmarks — plus the latest Rio Times coverage.
P
◆ Live Company Intelligence
Petroleo Brasileiro Petrobras
NYSE: PBRPETR4EnergyOil & Gas Integrated43,199 employees
$115.74B
Market cap
Analyst target $22.28

Wall Street view

4.4Buy/ 5
11 Buy3 Hold0 Sell
Avg. price target $22.28  ·  +36% vs 200-day

Valuation & profitability

Market cap$115.74B
Revenue (TTM)$498.09B
P / E ratio4.5
Profit margin21.6%
Return on equity25.6%

Price & risk

52-wk low
$10.97
52-wk high
$22.07
Beta (volatility)-0.22
200-day average$16.43

Revenue trend · 6y

20202025
Latest $88.10B

Ownership

Institutions21.6%
Shares outstanding3.72B
Top holderGQG Partners LLC
Institutional holders5+ funds

Dividend

No regular dividend — earnings reinvested for growth.
What Petroleo Brasileiro Petrobras does. Petróleo Brasileiro S.A. – Petrobras explores, produces, and sells oil and gas in Brazil, China, the United States, the Americas, Asia, Europe, Singapore, and internationally. It operates through three segments: Exploration and Production; Refining, Transportation & Marketing; and Gas & Low Carbon Energies. The Exploration and Production segment explores, develops, and produces…
Data: RT fundamentals (PBR.US) · figures in USD · as of 10 Aug 2026More company intelligence →

03 What moved it

The overriding driver was the futures market’s stubborn bet on a peace deal. Despite the expansion of hostilities to the Red Sea and the physical closure of the Strait of Hormuz, Brent crude lost its grip on US$80 a barrel earlier in the week and WTI followed suit by retreating below US$75, a signal that traders see current disruption as temporary.

On the supply side, record-breaking American crude production and surging LNG exports have absorbed much of the shock, giving Asian and European refiners a workable, if expensive, alternative to Middle Eastern barrels. In Washington, President Trump’s renewed threat to waive the Jones Act underscored the political pressure from gasoline prices above US$4 a gallon, yet the move is widely seen as symbolic because coastwise shipping accounts for a small slice of final fuel costs.

04 The Latin American read

Brazil’s pre-salt fields and Petrobras are being swept along by global macro currents rather than local fundamentals. The 3.02% slide in Petrobras shares to US$17.96 reflects a broader exit from emerging-market state oil companies as funds reassess the risk that a peace deal could erase the supply-driven price floor.

In Guyana, which does not trade on our board directly, the Exxon-led Stabroek block boom continues to attract capital even as the paper market wobbles, because its low break-even costs and proximity to the U.S. Gulf Coast make it a natural hedge against Hormuz risk. Mexico’s Pemex and Argentina’s Vaca Muerta story, meanwhile, are moving in opposite directions: Pemex’s heavy crude discount is widening again, while YPF’s tight 0.91% slip suggests the market is rewarding companies with export pipelines that bypass the Panama Canal and the Hormuz chokepoint entirely.

05 The names to watch

Petrobras remains the bellwether for the region, and its 3.02% single-session drop to US$17.96 suggests foreign portfolio money is reducing exposure ahead of any ceasefire announcement that would release Iranian and Iraqi barrels back into the market.

Ecopetrol’s 3.56% fall to US$16.78 makes it the worst performer among our tracked proxies, a move amplified by Colombia’s broader peso weakness and the market’s punishing view of companies with higher lifting costs. YPF, at US$49.16, is the only name on the board holding a constructive chart setup, having absorbed the Hormuz crisis as an accelerant for long-dated Vaca Muerta offtake deals rather than as a reason to sell.

06 The outlook

The week ahead hinges on peace-tracker headlines and the delayed physical impact of a still-shut Strait of Hormuz finally showing up in inventory data. If diplomatic progress stalls, the sudden rerating of oil equities could be violent, given how aggressively short positions have been built. For Latin American producers, the added wildcard is whether the Jones Act debate signals a broader U.S. sprint toward energy self-sufficiency that reshapes the competitive landscape for imported crude.

07 What to watch

  • Peace talk headlines: Any verified progress toward a ceasefire will likely depress crude prices further, while a breakdown could trigger a short-squeeze that lifts the entire Latin American oil board.
  • U.S. inventory data: The first official stockpile reports fully reflecting the Hormuz closure will reveal whether the physical market is as amply supplied as the paper market believes.
  • Petrobras dividend posture: The steep 3.02% drop to US$17.96 raises the question of whether management will defend the stock with an extraordinary shareholder distribution or conserve cash for pre-salt capex.
  • YPF’s Vaca Muerta offtake deals: The stock’s 0.91% retreat belies the flurry of contract negotiations with Asian buyers seeking non-Middle Eastern supply; any signed agreement could decouple YPF further from the global sell-off.

Frequently Asked Questions

Why did oil prices fall if the Strait of Hormuz is closed?

Traders have bet heavily on a quick peace deal that would restore Iranian and Iraqi crude flows. That has kept bearish pressure on WTI, tracked by USO, which slipped 0.75% to US$117.98 on Friday.

Why did Petrobras drop more than 3% in a single session?

Petrobras shares fell 3.02% to US$17.96 as global fund managers reduced exposure to emerging-market oil stocks ahead of a potential ceasefire, and a strong U.S. dollar added to the selling pressure.

How is Argentina’s YPF performing differently from other Latin American oil stocks?

YPF shed only 0.91% to US$49.16 because its Vaca Muerta shale assets are landlocked and insulated from Middle Eastern maritime chokepoints, making the stock a defensive play for foreign investors.

Does suspending the Jones Act actually lower U.S. gasoline prices?

Possibly, but the effect is limited. Waiving the Act allows cheaper foreign vessels to move oil between U.S. ports, yet coastwise shipping is only a small fraction of total fuel costs above US$4 a gallon.

This article was produced by The Rio Times’ automated newsroom system. How we use AI · Report an error

LatAm Markets: Live Signals → — real-time movers, turnover leaders and FX across Latin America.

Read More from The Rio Times

The Rio Times · Power Map
See who really holds power in Latin America
Click to open the Power Map

Rotate for Best Experience

This report is optimized for landscape viewing. Rotate your phone for the full experience.