Mexican Producer Prices Rise 2.99 Percent in August
MEXICO · INFLATION
Key Facts
- —The figure Mexico’s producer price index rose 2.99 percent year on year in August 2026.
- —A year ago 3.33 percent.
- —Last month 2.56 percent in July 2026.
- —The direction Up from July, down from a year earlier.
- —The source INEGI, published 9 September 2026.
- —The scope The INPP excludes oil and covers goods and services production.
Mexican producer prices ticked up in August without breaking out of the range they have held all year.
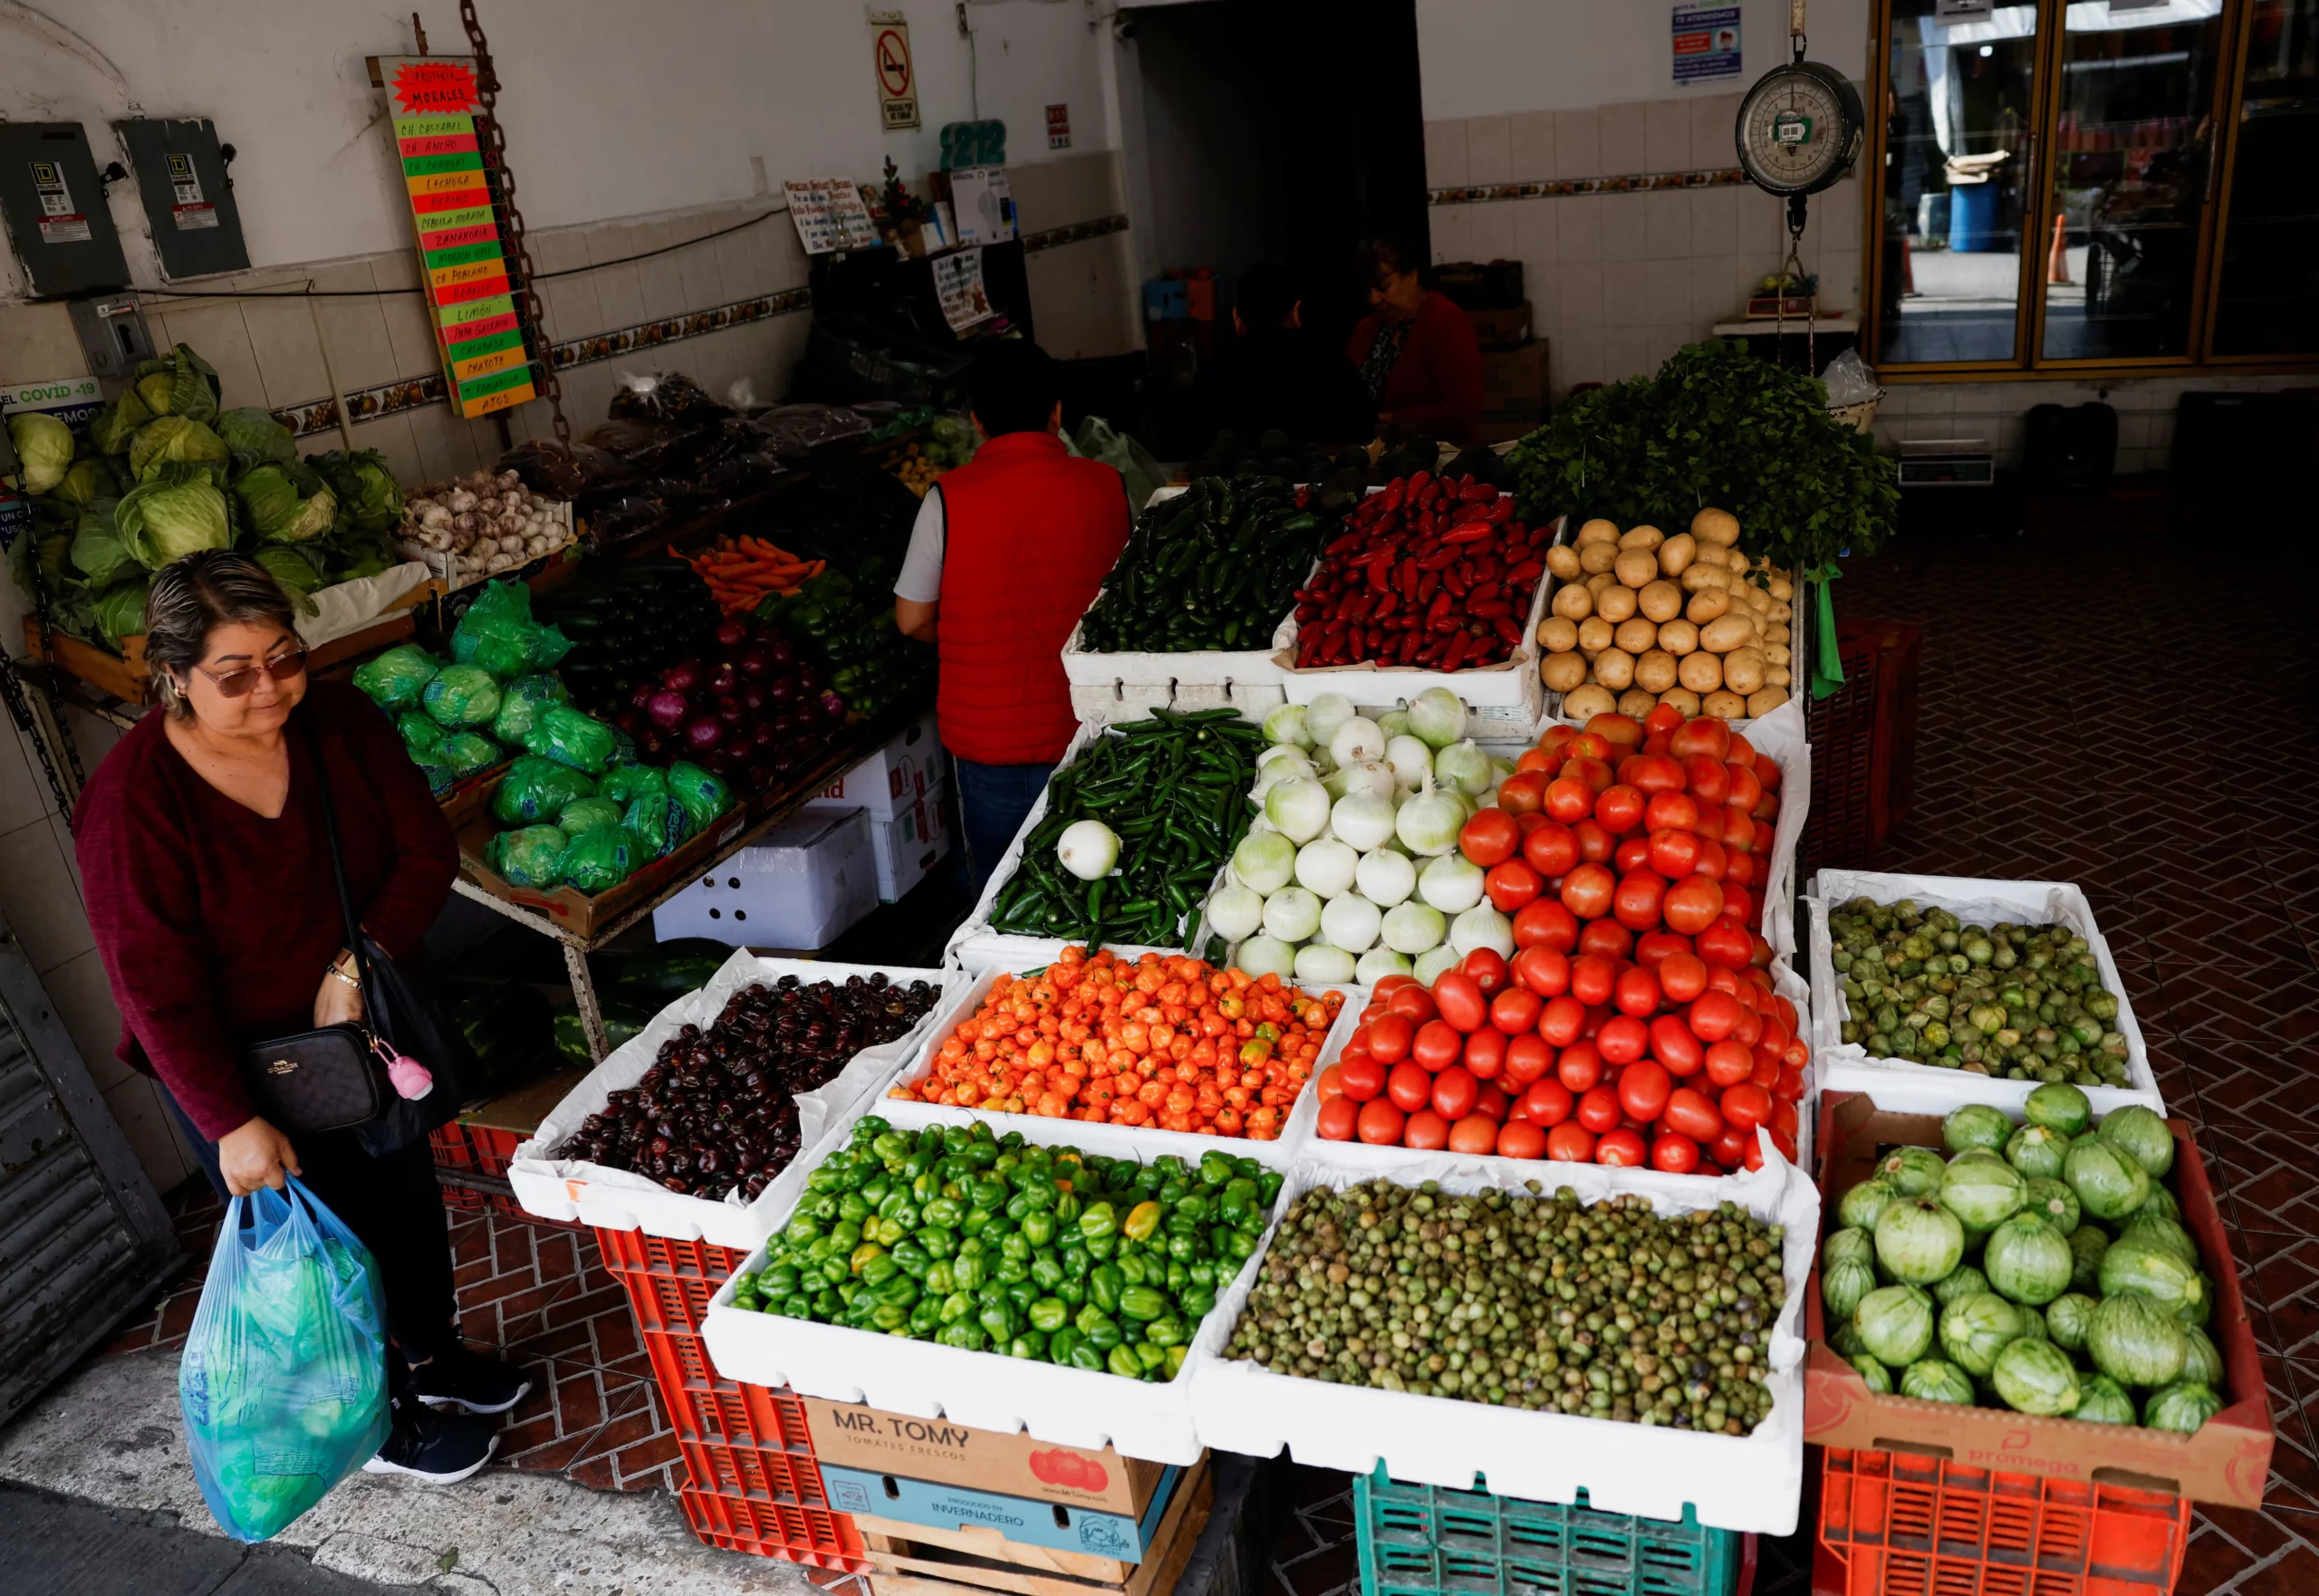
Mexico’s producer price index rose 2.99 percent in the twelve months to August 2026, according to INEGI, up from 2.56 percent in July and down from 3.33 percent a year earlier.
The Numbers
The annual rate of 2.99 percent compares with 2.56 percent in July 2026 and 3.33 percent in August 2025.
The reading was published by INEGI on 9 September 2026.
The INPP measures producer prices for goods and services excluding oil, and it is a leading indicator for consumer inflation to the extent that producers pass costs through.
How to Read It
The month-on-month acceleration from 2.56 to 2.99 percent is the number that will be noticed, and it is worth keeping in proportion. Producer price series are volatile and a four-tenths move in a single month is inside normal variation.
The more useful comparison is the year. At 2.99 percent against 3.33 percent a year earlier, producer inflation is lower than it was, and it has spent 2026 in a narrow band.
That is the picture of an economy where input cost pressure is neither building nor collapsing.
Live Market IntelligenceMexico — Live Market Board
Rio Times · Live Market Intelligence
Mexico — Live Market Board
-0.39%
185,146.69
-0.26%
64,814.97
-0.39%
11,289.90
-0.71%
3,107,396
-0.09%
2,580.41
-0.14%
60,702.89
-1.24%
| Instrument | Last | Change | YoY | Prev. | High | Low | Volume |
|---|---|---|---|---|---|---|---|
| IPC MEX | 64,814.97 | -0.39% | +12.17% | 65,065.56 | 66,121 | 65,405 | 108,886,187 |
| USD/MXN | 17.06 | -0.24% | -8.58% | 17.10 | 17.08 | 17.01 | — |
| WALMEX | 48.07 | -0.62% | -14.38% | 48.37 | 48.65 | 48.02 | 10,781,446 |
| GMEXICO | 223.28 | +0.35% | +73.59% | 222.50 | 226.18 | 222.17 | 1,325,556 |
| FEMSA | 201.19 | -0.24% | +25.67% | 201.67 | 206.71 | 199.56 | 750,706 |
| CEMEX | 19.32 | +0.89% | +19.10% | 19.15 | 19.35 | 19.04 | 14,327,054 |
| GFNORTE | 193.98 | +1.18% | +14.36% | 191.71 | 195.79 | 191.83 | 1,579,115 |
| BIMBO | 60.98 | -0.96% | +11.89% | 61.57 | 61.46 | 60.29 | 1,048,115 |
| TELEVISA | 9.71 | +0.21% | +12.78% | 9.69 | 9.75 | 9.60 | 577,851 |
| AMX | 19.80 | -0.95% | +12.53% | 19.99 | 20.05 | 19.70 | 58,058,525 |
| GAP | 366.23 | +0.43% | -21.21% | 364.68 | 370.85 | 362.82 | 226,946 |
| ASUR | 275.04 | +1.25% | -15.28% | 271.64 | 275.08 | 271.31 | 15,451 |
| OMA | 233.50 | +0.62% | -6.48% | 232.06 | 235.00 | 230.62 | 555,693 |
| KOF | 188.04 | +0.86% | +18.94% | 186.44 | 188.56 | 185.52 | 425,273 |
| GRUMA | 252.90 | +0.11% | -21.85% | 252.61 | 254.74 | 250.36 | 90,048 |
| KIMBER | 39.74 | +0.43% | +8.85% | 39.57 | 40.09 | 39.33 | 490,551 |
| AMX ADR | 23.38 | -0.23% | +22.25% | 23.43 | 23.49 | 23.06 | 1,347,445 |
What Sits Behind It
The obvious external variable is energy. Brent crude passed US$100 a barrel on 9 September, and an oil price at that level feeds into producer costs across transport, chemicals and manufacturing with a lag of several months.
August data therefore does not contain it. September and October data will.
The peso’s behaviour is the second variable, because a large share of Mexican industrial inputs is imported and priced in dollars.
What the Index Actually Covers
The Índice Nacional de Precios Productor is not a single number so much as a family of them. INEGI publishes a headline series excluding oil, a series including it, and breakdowns by economic activity, by stage of production and by intermediate against final demand.
The headline figure quoted in most coverage is the total excluding oil, which is the series designed to show underlying cost pressure rather than the swings that crude imposes on everything downstream.
That construction is the reason the August reading does not yet contain the September oil move. It is also the reason the INPP is watched at all: a producer price series that simply tracked crude would tell readers nothing they could not get from a Brent screen.
INEGI publishes it monthly, usually within the first ten days of the following month, alongside the consumer price index. The two are read together because the gap between them is where margin compression shows up.
The Pass-Through Question
Producer prices matter to households only to the extent that producers can pass costs on. In Mexico that has been uneven through 2026.
Formal manufacturers selling into export markets have limited pricing power, because their customers are largely in the United States and their contracts are dollar-denominated. Domestic services and retail have more room, and that is where consumer inflation has been stickiest.
A producer index running just under 3 percent alongside a consumer index that has been running higher implies producers are absorbing rather than passing on. That is comfortable for the inflation outlook and uncomfortable for corporate margins.
Bank of Mexico watches the relationship rather than either series alone. A widening gap between producer and consumer inflation eventually resolves in one of two directions, and which direction it resolves in shapes the rate path.
What Comes Next
The September and October readings are the ones that will carry the oil effect. Brent above US$100 feeds into transport, petrochemicals, fertiliser and plastics with a lag of roughly one to three months depending on the input.
The peso is the second channel. Mexican industry imports a large share of its intermediate inputs priced in dollars, so the exchange rate acts on producer costs faster than the oil price does.
Neither variable is under domestic control, which is the recurring frustration of Mexican inflation management. The policy tools address demand, and the pressure this autumn is coming from the supply side.
More: Mexico news in English, every day from The Rio Times.
Frequently Asked Questions
What was Mexico’s producer inflation in August?
2.99 percent year on year, according to INEGI.
How does that compare?
Up from 2.56 percent in July 2026 and down from 3.33 percent in August 2025.
What does the index measure?
Producer prices for goods and services excluding oil.
Is the increase significant?
A four-tenths monthly move is inside normal variation for this series. The annual comparison is the more useful figure.
What could change it?
Brent crude passing US$100 on 9 September will feed into producer costs with a lag, so it is not in the August data.
Sources: INEGI.
This article was drafted with automated assistance and reviewed before publication. How we use AI · Report an error
In depth
Read More from The Rio Times