Mexico GDP Grows 1.5%, Best Quarter in Five Years — On the World Cup
Mexico · Economy
Key Facts
—Quarterly growth. GDP expanded 1.5% in Q2 2026 against the previous quarter, seasonally adjusted.
—Best in five years. The strongest quarterly reading since Q4 2020, 22 quarters ago.
—Annual rate. Output grew 2.1% year-on-year; the first half is up 1.2%.
—Reversal. Follows a 0.6% contraction in the first quarter of 2026.
—The catch. Banco Base estimates roughly two-thirds of the quarterly gain came from the World Cup.
Mexico’s economy grew 1.5% in the second quarter of 2026 against the first, INEGI reported on 30 July in its preliminary estimate — the strongest quarterly expansion in five and a half years. All three broad sectors advanced after contracting simultaneously in the first quarter.
Economists attached a caveat within hours: most of the lift came from a tournament that has now ended. The host-city spending spike is clearly visible in the breakdown but unlikely to sustain itself into the second half.
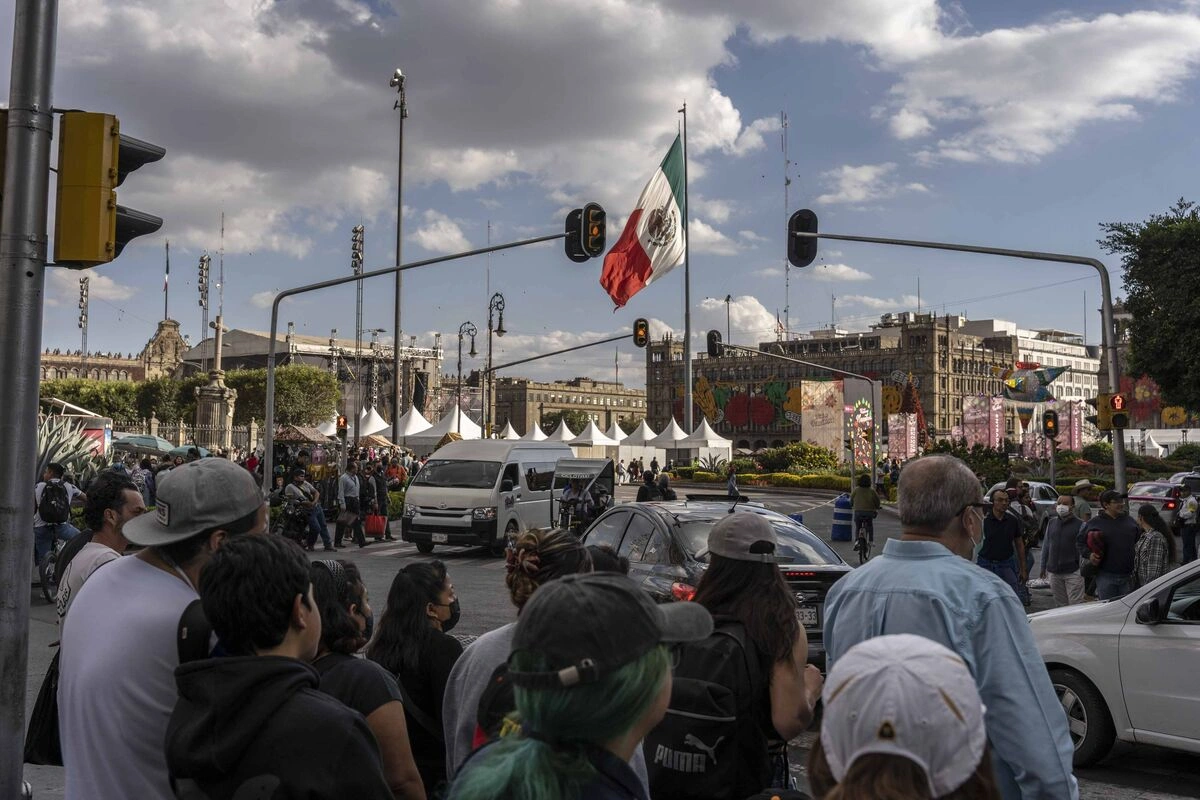
What Drove Mexico’s Best Quarter Since 2020
Primary activities — agriculture and livestock — rose 3.3% on the quarter, their best showing since the first quarter of 2025, and 7.3% year-on-year. The strong performance reflected favourable weather and a recovery in crop yields that had been depressed earlier.
Secondary activities, covering manufacturing and construction, grew 1.6%, the strongest quarterly result in 17 quarters. Pre-tournament infrastructure work and a modest rebound in factory output underpinned the advance.
Tertiary activities, roughly two-thirds of Mexican GDP, expanded 1.5% — like the headline figure, the best since the last quarter of 2020. Services grew 2.5% against a year earlier, driven by an extraordinary burst of consumption in the three host cities.
How the World Cup Lifted the Numbers
Gabriela Siller, head of economic analysis at Grupo Financiero Base, put a number on the distortion: approximately two-thirds of the quarterly growth was due to the World Cup effect, she said, with the rest a rebound after the first-quarter contraction. Her breakdown implies that without the tournament, the economy would have posted only a modest expansion.
Mexico hosted 13 matches. Construction spending ran ahead of the tournament, concentrated in April and May, lifting the secondary sector as stadiums, roads and fan zones were finished.
Retail trade and services consumption in the three host cities — Mexico City, Guadalajara and Monterrey — drove the tertiary gain. Hotels, restaurants and transport services all recorded sharp increases that are not expected to persist.
The calendar effect was so large that it masked underlying sluggishness. Siller expects a contraction once the effect washes out, because the temporary demand was borrowed from future quarters rather than a sign of new momentum.
The quarter also benefited from a statistical rebound. After the 0.6% drop in the first quarter, any return to normal activity levels mechanically added to the growth rate, compounding the World Cup boost.
Why Economists Say the Trend Has Not Changed
The rebound follows a first quarter in which output shrank 0.6%, dragged down by weakness in industry and particularly construction. That contraction itself interrupted a long period of sub-par expansion that has characterised much of the past decade.
For the year to date, the economy is 1.2% larger than in the first half of 2025. The OECD, the IMF and the World Bank all see Mexican growth reaching at most 1.5% in 2026 — again below the country’s historical average of 2.1% a year.
The quarter does not signal a change of trend, Siller said, nor does it mean the stagnation of the past decade has been broken. The structural constraints on Mexican growth are unchanged; what changed was the calendar.
Those structural constraints include low investment rates, widespread informality, regulatory bottlenecks and security challenges that have held back productivity gains. Temporary bursts of spending cannot overcome them, and the economy is likely to revert to its long-term path once the World Cup stimulus fades.
Financial markets appeared to recognise the temporary nature of the data. Traders kept the peso largely stable and bond yields moved little, suggesting that the one-off jump was already priced in.
Banco de México’s own surveys of private-sector analysts show that most expect growth to resume a modest pace in the second half. Their median forecast for the full year remains at 1.2%, well within the range implied by the international agencies.
How INEGI Builds the Preliminary Estimate
The Estimación Oportuna del Producto Interno Bruto Trimestral is released 30 days after a quarter closes, drawing on available statistics, statistical techniques and econometric models. It relies heavily on early indicators such as industrial production, retail sales and services surveys that are prone to revision.
Results are consistent with Mexico’s System of National Accounts and are subject to revision when the full quarterly release lands. Historically, the revision between the timely estimate and the final GDP data has averaged a few tenths of a percentage point, but the direction of the adjustment can matter for policy.
The second-quarter reading will be revisited in late August when INEGI publishes the traditional quarterly GDP report with a richer sectoral breakdown. At that point, analysts will be able to see exactly how much each component was boosted by the tournament and how much came from organic demand.
For now, the statistics agency’s preliminary work confirms that the World Cup delivered an outsized lift that does not alter the nation’s medium-term economic narrative. Policymakers and investors are therefore looking through the headline figure to the more sober reality beneath.
Connected Coverage
Mexico Markets: IPC & the Peso — July 30, 2026 · Fitch: Pemex Burden Costs Mexico a Notch, BBB- Holds
More: Latin America news in English, every day from The Rio Times.
Frequently Asked Questions
How fast did Mexico’s economy grow in Q2 2026?
GDP rose 1.5% against the previous quarter on a seasonally adjusted basis, and 2.1% against the same quarter of 2025, according to INEGI’s preliminary estimate. This represents the strongest quarterly expansion since the final quarter of 2020.
Why was the second quarter so strong?
Banco Base estimates around two-thirds of the quarterly gain came from the 2026 World Cup, through pre-tournament construction and higher retail and services consumption in host cities. The remainder was a rebound from the first-quarter contraction.
What is Mexico’s growth forecast for 2026?
The OECD, IMF and World Bank all put full-year growth at no more than 1.5%, below Mexico’s historical average of 2.1%. The rebound therefore does not alter the overall subdued trajectory for the year.
Sources
This article was produced by The Rio Times’ automated newsroom system. How we use AI · Report an error
Read More from The Rio Times