IBOV 171,031.73 ▲ 1.85% IPSA 11,337.85 ▲ 0.89% IPC MEX 65,223.89 ▲ 1.36% MERVAL 2,913,184 ▲ 1.30% COLCAP 2,459.23 ▲ 0.61% BVL PERÚ 58,698.13 ▲ 2.60% USD/BRL5.14▼ 1.15% USD/MXN16.91▼ 0.27% USD/CLP914.28▼ 0.85% USD/COP3,037▼ 0.47% USD/PEN3.35▼ 0.06% USD/ARS1,499▲ 0.12% USD/UYU40.20▲ 1.58% USD/PYG5,996▲ 1.55% USD/BOB11.43▲ 0.41% USD/DOP58.82▲ 0.20% USD/CRC450.05▲ 3.34% USD/GTQ7.62▲ 2.21% USD/HNL26.81▲ 0.31% USD/NIO36.62▲ 0.29% USD/VES778.00▼ 0.13% USD/PAB1.00— 0.00% USD/BZD2.00— 0.00% USD/JMD 157.28 — 0.00% USD/TTD6.71▲ 0.79% EUR/BRL6.00▼ 0.63% BRENT 88.88 ▼ 0.03% WTI 83.11 ▼ 0.11% IRON ORE 161.91 — — COPPER 6.61 ▲ 0.03% GOLD 4,461 ▲ 1.78% SILVER 65.59 ▲ 1.26% SOY 1,184 ▲ 3.20% CORN 480.50 ▲ 10.02% WHEAT 655.00 ▲ 3.93% COFFEE 317.25 ▼ 5.51% SUGAR 16.43 ▼ 1.79% ORANGE JUICE 138.55 ▼ 0.47% COTTON 85.03 ▲ 2.33% COCOA 5,719 ▲ 3.18% BEEF 223.60 ▼ 3.93% CATTLE 339.10 ▼ 3.16% LITHIUM 75.20 ▲ 1.47% PETR4 41.64 ▼ 0.05% VALE3 72.97 ▲ 0.83% ITUB4 38.60 ▼ 1.03% BBDC4 16.85 ▲ 0.36% ABEV3 14.89 ▼ 0.80% BBAS3 19.37 ▲ 0.47% B3SA3 14.26 ▼ 0.21% WEGE3 47.59 ▲ 0.49% PRIO3 59.14 ▼ 0.19% SUZB3 41.33 ▲ 2.35% RENT3 34.68 ▼ 0.09% AZZA3 15.89 ▼ 2.63% CSAN3 3.22 ▼ 1.83% RAIZ4 0.25 — 0.00% PCAR3 2.75 ▼ 0.36% GMAT3 3.65 ▼ 1.08% PSSA3 48.13 ▼ 0.54% CVCB3 1.33 ▼ 2.92% POSI3 3.36 ▲ 2.44% SLCE3 13.34 ▲ 0.30% NATU3 8.14 ▼ 0.73% IBOV 171,031.73 ▲ 1.85% IPSA 11,337.85 ▲ 0.89% IPC MEX 65,223.89 ▲ 1.36% MERVAL 2,913,184 ▲ 1.30% COLCAP 2,459.23 ▲ 0.61% BVL PERÚ 58,698.13 ▲ 2.60% USD/BRL 5.16 ▲ 0.01% USD/MXN 17.06 ▼ 0.24% USD/CLP 913.98 ▲ 0.04% USD/COP 3,140 ▲ 0.03% USD/PEN 3.36 ▼ 0.66% USD/ARS 1,493 ▲ 0.10% USD/UYU 40.27 ▲ 1.24% USD/PYG 5,939 ▲ 1.68% USD/BOB 11.64 ▼ 0.76% USD/DOP 58.34 ▲ 1.25% USD/CRC 445.92 ▲ 0.89% USD/GTQ 7.62 ▲ 2.21% USD/HNL 26.79 ▲ 1.57% USD/NIO 36.62 ▲ 0.69% USD/VES 762.44 ▼ 0.13% USD/PAB 1.00 — 0.00% USD/BZD 2.00 — 0.00% USD/JMD 157.28 — 0.00% USD/TTD 6.70 ▲ 0.61% EUR/BRL 5.95 ▲ 1.01% BRENT 88.88 ▼ 0.03% WTI 83.11 ▼ 0.11% IRON ORE 161.91 — — COPPER 6.61 ▲ 0.03% GOLD 4,461 ▲ 1.78% SILVER 65.59 ▲ 1.26% SOY 1,184 ▲ 3.20% CORN 480.50 ▲ 10.02% WHEAT 655.00 ▲ 3.93% COFFEE 317.25 ▼ 5.51% SUGAR 16.43 ▼ 1.79% ORANGE JUICE 138.55 ▼ 0.47% COTTON 85.03 ▲ 2.33% COCOA 5,719 ▲ 3.18% BEEF 223.60 ▼ 3.93% CATTLE 339.10 ▼ 3.16% LITHIUM 75.20 ▲ 1.47% PETR4 41.64 ▼ 0.05% VALE3 72.97 ▲ 0.83% ITUB4 38.60 ▼ 1.03% BBDC4 16.85 ▲ 0.36% ABEV3 14.89 ▼ 0.80% BBAS3 19.37 ▲ 0.47% B3SA3 14.26 ▼ 0.21% WEGE3 47.59 ▲ 0.49% PRIO3 59.14 ▼ 0.19% SUZB3 41.33 ▲ 2.35% RENT3 34.68 ▼ 0.09% AZZA3 15.89 ▼ 2.63% CSAN3 3.22 ▼ 1.83% RAIZ4 0.25 — 0.00% PCAR3 2.75 ▼ 0.36% GMAT3 3.65 ▼ 1.08% PSSA3 48.13 ▼ 0.54% CVCB3 1.33 ▼ 2.92% POSI3 3.36 ▲ 2.44% SLCE3 13.34 ▲ 0.30% NATU3 8.14 ▼ 0.73%
since 2009
Friday, August 21, 2026

Mexico Data Centres Are Set for US$20.6 Billion by 2031

By · August 21, 2026 · 4 min read

Daily Brief

The morning intel from across Latin America. Free.

By subscribing you agree to our privacy policy. We never share your email.

Mexico · TECHNOLOGY

Key Facts

  • Direct investment US$20.63 billion projected for 2026-2031
  • Indirect investment US$61.89 billion projected for the same period
  • Source 2026 Mexico Data Center Market report by MEXDC
  • Main regions Querétaro, State of Mexico, Mexico City metro, Bajío
  • Key operators Microsoft, Amazon Web Services, Google Cloud, Oracle, Equinix, Odata, Kio Networks

An industry group sees US$61.89 billion in wider economic activity following the direct spending on server buildings.

Mexico data centres - the aqueduct and skyline of Querétaro
Illustrative photo: Querétaro, the country’s main data centre cluster. MEXDC projects US$20.63 billion of direct investment between 2026 and 2031. (Photo: Adam Jones, CC BY-SA 2.0, Wikimedia Commons.)
One-stop reference
Company Intelligence
Every listed company in Latin America — financials, ownership and structure for 1,450+ companies across 26 exchanges, in one place.
Browse the directory →

Mexico data centres are set for a massive expansion, with US$20.63 billion in direct investment projected between 2026 and 2031. The figure comes from the Mexican Data Center Association, known as MEXDC, according to Mexico Business News.

What the Projection Says

The MEXDC report, titled 2026 Mexico Data Center Market, outlines the investment outlook. Direct investment refers to money spent on the data centres themselves.

In addition, the report projects US$61.89 billion in indirect investment. That means the wider economic activity that follows, such as construction jobs and local services.

Who Made the Forecast

The projection comes from an industry association, not from a Mexican government ministry. MEXDC represents companies that build and operate data centres.

Therefore, the numbers reflect the sector’s own expectations. Mexico Business News reported the figures on 14 July 2026.

Live Market IntelligenceMexico — Live Market BoardInside: market breadth, the sector heatmap, currencies & rates, the Latin America scoreboard and the full instrument board.

Rio Times · Live Market Intelligence

Mexico — Live Market Board

BMV · Mexico City
Aug 21, 2026 · 18:48

S&P/BMV IPC · benchmark
65,223.89
+1.36%
L 65,405day rangeH 66,121

+12.17% over 12 months

Market breadth · 15 names
67% advancing

10 ▲ advancing5 declining ▼

Currencies, rates & key inputs
USD / MXN
17.06
-0.24%

Brent crude
88.88
-0.03%

Gold
4,461
+1.78%

Sector heatmap · average move today
Financials
+1.18%
GFNORTE

Materials
+0.89%
CEMEX

Industrials
+0.77%
GAP, ASUR, OMA

Mining
+0.35%
GMEXICO

Consumer Staples
-0.07%
WALMEX, FEMSA, BIMBO, KOF

Other
-0.23%
AMX ADR

Telecom
-0.37%
TELEVISA, AMX

Latin America scoreboard
IndexLastTodayStrength
IbovespaBrazil
171,031.73
+1.85%

S&P/BMV IPCMexico
65,223.89
+1.36%

S&P IPSAChile
11,337.85
+0.89%

S&P MERVALArgentina
2,913,184
+1.30%

MSCI COLCAPColombia
2,459.23
+0.61%

BVL S&P PerúPeru
58,698.13
+2.60%

Full instrument board
Instrument Last Change YoY Prev. High Low Volume
IPC MEX 65,223.89 +1.36% +12.17% 64,349.80 66,121 65,405 108,886,187
USD/MXN 17.06 -0.24% -8.58% 17.10 17.08 17.01
WALMEX 48.07 -0.62% -14.38% 48.37 48.65 48.02 10,781,446
GMEXICO 223.28 +0.35% +73.59% 222.50 226.18 222.17 1,325,556
FEMSA 201.19 -0.24% +25.67% 201.67 206.71 199.56 750,706
CEMEX 19.32 +0.89% +19.10% 19.15 19.35 19.04 14,327,054
GFNORTE 193.98 +1.18% +14.36% 191.71 195.79 191.83 1,579,115
BIMBO 60.98 -0.96% +11.89% 61.57 61.46 60.29 1,048,115
TELEVISA 9.71 +0.21% +12.78% 9.69 9.75 9.60 577,851
AMX 19.80 -0.95% +12.53% 19.99 20.05 19.70 58,058,525
GAP 366.23 +0.43% -21.21% 364.68 370.85 362.82 226,946
ASUR 275.04 +1.25% -15.28% 271.64 275.08 271.31 15,451
OMA 233.50 +0.62% -6.48% 232.06 235.00 230.62 555,693
KOF 188.04 +0.86% +18.94% 186.44 188.56 185.52 425,273
GRUMA 252.90 +0.11% -21.85% 252.61 254.74 250.36 90,048
KIMBER 39.74 +0.43% +8.85% 39.57 40.09 39.33 490,551
AMX ADR 23.38 -0.23% +22.25% 23.43 23.49 23.06 1,347,445

Largest moves today
IPC MEX
65,223.89
+1.36%
ASUR
275.04
+1.25%
GFNORTE
193.98
+1.18%
BIMBO
60.98
-0.96%
AMX
19.80
-0.95%
CEMEX
19.32
+0.89%
KOF
188.04
+0.86%
WALMEX
48.07
-0.62%

The session read
The S&P/BMV IPC rose 1.36%, with breadth positive — 10 of 15 names higher. Financials led, while Telecom lagged.

Why Mexico Data Centres Matter

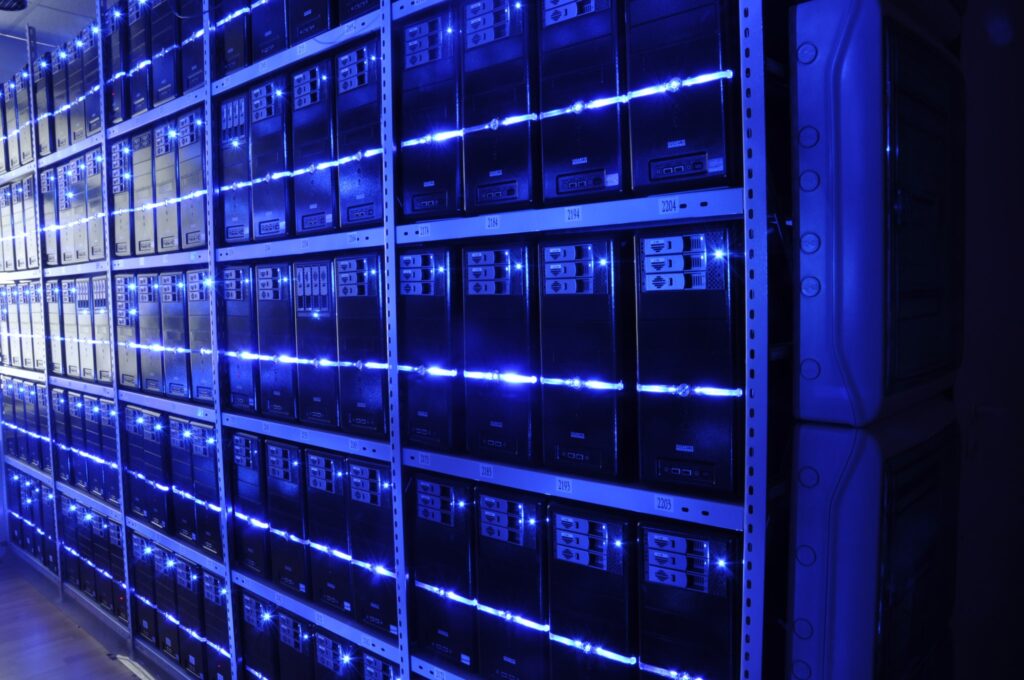
A data centre is a building full of computer servers. It is where cloud services, streaming and artificial intelligence models physically run.

So when Mexico data centres grow, they support everything from video calls to online banking. That makes the investment relevant for everyday users.

Main Regions for Growth

Sector coverage points to Querétaro as a key hub. The State of Mexico and the Mexico City metropolitan area also stand out.

Meanwhile, the Bajío region, including Guanajuato, is another area of focus. These clusters attract much of the new spending.

Key Players in the Market

Operators and investors linked to Mexico data centres include Microsoft and Amazon Web Services. Google Cloud, Oracle, Equinix, Odata and Kio Networks are also active.

However, the report does not tie specific amounts to individual companies. The US$20.63 billion is a sector-wide projection.

Direct vs Indirect Investment

Direct investment covers the construction and equipment of the data centres. Indirect investment measures the ripple effect on the economy.

For example, new facilities create demand for power, cooling and maintenance. Local suppliers and workers benefit as a result.

What This Means for the Future

The projected spending suggests a strong bet on digital growth in Mexico. Companies are preparing for more cloud and AI use.

Still, the forecast is an industry view, not a government promise. Market conditions could change the final numbers.

How to Read the Numbers

The US$20.63 billion figure covers a six-year window. It is a cumulative projection, not an annual budget.

In short, it signals confidence in the sector’s expansion. Investors and observers should watch for actual developments.

Next Steps for Mexico Data Centres

As the industry grows, attention will turn to infrastructure and skills. The main clusters will likely see the most activity.

Overall, the report paints a picture of rapid build-out. Time will tell if the investment matches the projection.

Frequently Asked Questions

What is the projected investment in Mexico data centres?

The MEXDC projects US$20.63 billion in direct investment from 2026 to 2031. It also sees US$61.89 billion in indirect investment.

Who made the forecast for Mexico data centres?

The Mexican Data Center Association, or MEXDC, made the forecast. It is an industry group, not a government agency.

Which regions will see the most data centre growth?

Querétaro, the State of Mexico and the Mexico City metropolitan area are key. The Bajío region, including Guanajuato, is also important.

What does direct investment mean in this context?

Direct investment means money spent on the data centres themselves. Indirect investment refers to the wider economic activity that follows.

Connected Coverage

Sources: MEXDC; Mexico Business News.

This article was produced by The Rio Times’ automated newsroom system. How we use AI · Report an error

Read More from The Rio Times

The Rio Times · Power Map
See who really holds power in Latin America
Click to open the Power Map

Rotate for Best Experience

This report is optimized for landscape viewing. Rotate your phone for the full experience.