IBOV 185,147.15 ▼ 0.02% IPSA 11,315.26 ▼ 1.14% IPC MEX 64,727.54 ▼ 0.21% MERVAL 3,034,599 ▲ 1.11% COLCAP 2,565.50 ▲ 0.82% BVL PERÚ 59,789.81 — — USD/BRL5.09▼ 0.65% USD/MXN16.95▲ 0.23% USD/CLP926.55▼ 0.85% USD/COP3,107▼ 0.69% USD/PEN3.36▼ 0.08% USD/ARS1,506▼ 0.38% USD/UYU40.24— 0.00% USD/PYG5,947— 0.00% USD/BOB12.45▲ 2.03% USD/DOP58.58▲ 0.13% USD/CRC446.50▲ 1.13% USD/GTQ7.64▲ 2.32% USD/HNL26.84▲ 1.63% USD/NIO36.62▲ 0.69% USD/VES812.65▼ 0.13% USD/PAB1.00— 0.00% USD/BZD2.00— 0.00% USD/JMD 157.28 — 0.00% USD/TTD6.71▲ 1.06% EUR/BRL5.92▼ 0.56% BRENT 88.88 ▼ 0.03% WTI 83.11 ▼ 0.11% IRON ORE 161.91 — — COPPER 6.61 ▲ 0.03% GOLD 4,461 ▲ 1.78% SILVER 65.59 ▲ 1.26% SOY 1,184 ▲ 3.20% CORN 480.50 ▲ 10.02% WHEAT 655.00 ▲ 3.93% COFFEE 317.25 ▼ 5.51% SUGAR 16.43 ▼ 1.79% ORANGE JUICE 138.55 ▼ 0.47% COTTON 85.03 ▲ 2.33% COCOA 5,719 ▲ 3.18% BEEF 223.60 ▼ 3.93% CATTLE 339.10 ▼ 3.16% LITHIUM 75.20 ▲ 1.47% PETR4 41.64 ▼ 0.05% VALE3 72.97 ▲ 0.83% ITUB4 38.60 ▼ 1.03% BBDC4 16.85 ▲ 0.36% ABEV3 14.89 ▼ 0.80% BBAS3 19.37 ▲ 0.47% B3SA3 14.26 ▼ 0.21% WEGE3 47.59 ▲ 0.49% PRIO3 59.14 ▼ 0.19% SUZB3 41.33 ▲ 2.35% RENT3 34.68 ▼ 0.09% AZZA3 15.89 ▼ 2.63% CSAN3 3.22 ▼ 1.83% RAIZ4 0.25 — 0.00% PCAR3 2.75 ▼ 0.36% GMAT3 3.65 ▼ 1.08% PSSA3 48.13 ▼ 0.54% CVCB3 1.33 ▼ 2.92% POSI3 3.36 ▲ 2.44% SLCE3 13.34 ▲ 0.30% NATU3 8.14 ▼ 0.73% IBOV 185,147.15 ▼ 0.02% IPSA 11,315.26 ▼ 1.14% IPC MEX 64,727.54 ▼ 0.21% MERVAL 3,034,599 ▲ 1.11% COLCAP 2,565.50 ▲ 0.82% BVL PERÚ 59,789.81 — — USD/BRL 5.16 ▲ 0.01% USD/MXN 17.06 ▼ 0.24% USD/CLP 913.98 ▲ 0.04% USD/COP 3,140 ▲ 0.03% USD/PEN 3.36 ▼ 0.66% USD/ARS 1,493 ▲ 0.10% USD/UYU 40.27 ▲ 1.24% USD/PYG 5,939 ▲ 1.68% USD/BOB 11.64 ▼ 0.76% USD/DOP 58.34 ▲ 1.25% USD/CRC 445.92 ▲ 0.89% USD/GTQ 7.62 ▲ 2.21% USD/HNL 26.79 ▲ 1.57% USD/NIO 36.62 ▲ 0.69% USD/VES 762.44 ▼ 0.13% USD/PAB 1.00 — 0.00% USD/BZD 2.00 — 0.00% USD/JMD 157.28 — 0.00% USD/TTD 6.70 ▲ 0.61% EUR/BRL 5.95 ▲ 1.01% BRENT 88.88 ▼ 0.03% WTI 83.11 ▼ 0.11% IRON ORE 161.91 — — COPPER 6.61 ▲ 0.03% GOLD 4,461 ▲ 1.78% SILVER 65.59 ▲ 1.26% SOY 1,184 ▲ 3.20% CORN 480.50 ▲ 10.02% WHEAT 655.00 ▲ 3.93% COFFEE 317.25 ▼ 5.51% SUGAR 16.43 ▼ 1.79% ORANGE JUICE 138.55 ▼ 0.47% COTTON 85.03 ▲ 2.33% COCOA 5,719 ▲ 3.18% BEEF 223.60 ▼ 3.93% CATTLE 339.10 ▼ 3.16% LITHIUM 75.20 ▲ 1.47% PETR4 41.64 ▼ 0.05% VALE3 72.97 ▲ 0.83% ITUB4 38.60 ▼ 1.03% BBDC4 16.85 ▲ 0.36% ABEV3 14.89 ▼ 0.80% BBAS3 19.37 ▲ 0.47% B3SA3 14.26 ▼ 0.21% WEGE3 47.59 ▲ 0.49% PRIO3 59.14 ▼ 0.19% SUZB3 41.33 ▲ 2.35% RENT3 34.68 ▼ 0.09% AZZA3 15.89 ▼ 2.63% CSAN3 3.22 ▼ 1.83% RAIZ4 0.25 — 0.00% PCAR3 2.75 ▼ 0.36% GMAT3 3.65 ▼ 1.08% PSSA3 48.13 ▼ 0.54% CVCB3 1.33 ▼ 2.92% POSI3 3.36 ▲ 2.44% SLCE3 13.34 ▲ 0.30% NATU3 8.14 ▼ 0.73%
since 2009
Tuesday, September 8, 2026

Latin America Argentina

M&A Activity in Latin America: Fewer Deals but Increased Value in 2024

By · December 10, 2024 · 2 min read

The LatAm Brief

One email, every weekday morning. What moved in Latin American markets, politics and expat life.

Yesterday’s subject line: “227 dead in Latin American waters. Yesterday, none.”

Free. We send a confirmation link first — nothing arrives until you click it. Unsubscribe with one click in any edition. If you stop opening us for 30 days we stop sending by ourselves, as we assume the interest is no longer there. See our privacy policy. We never share your email.

As of November 2024, the mergers and acquisitions (M&A) market in Latin America has reached a total value of $73.924 billion.

This figure reveals an 18% drop in the number of transactions compared to last year, yet the overall value of these deals has increased by 9%. This situation raises questions about the evolving dynamics of the region’s business landscape.

The data shows that there were 2,528 M&A transactions announced or completed up to November. In October alone, 181 transactions contributed $7.824 billion to the total value.

The decline in transaction volume suggests that companies are becoming more selective, focusing on larger and potentially more impactful deals.

Brazil remains the largest market for M&A activity with 1,474 transactions, despite a 23% decrease in activity. Interestingly, the capital mobilized in Brazil rose by 11%, totaling $43.145 billion.
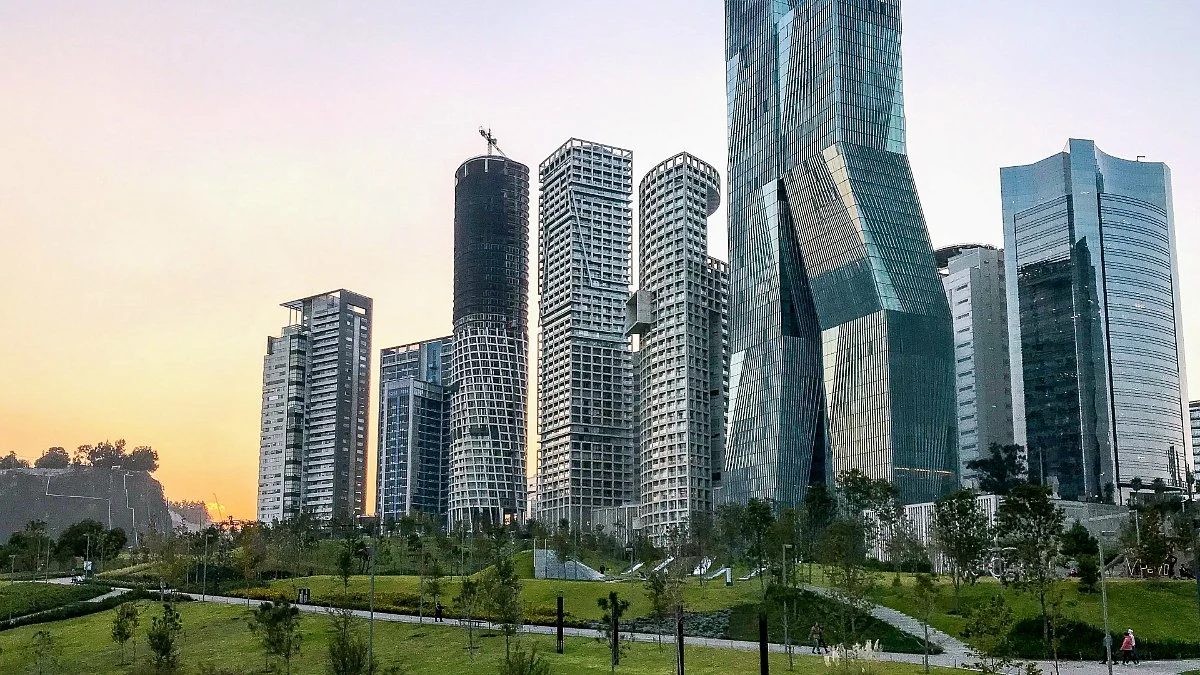
M&A Activity in Latin America: Fewer Deals but Increased Value in 2024
M&A Activity in Latin America: Fewer Deals but Increased Value in 2024.
One-stop reference
Company Intelligence
Every listed company in Latin America — financials, ownership and structure for 1,450+ companies across 26 exchanges, in one place.
Browse the directory →
RT
Ask Rio Times
17 years of Latin America reporting, on demand.
Open the full Ask Rio Times →

This indicates that while fewer deals are happening, they tend to be larger and more strategic. Mexico follows with 397 transactions, down by 10% from last year.

However, the capital mobilized increased by 20%, reaching $15.146 billion. This growth suggests that investors still see Mexico as a favorable environment for business, even amid challenges.

Latin America’s M&A Landscape

Colombia ranks fourth with 243 transactions, experiencing a slight decline of 5% year-on-year. Despite this, Colombia saw a significant increase in capital mobilized, rising by 31% to $6.391 billion.

This reflects growing confidence among foreign investors who are attracted to Colombia’s economic potential. Chile is noteworthy as well, with 310 transactions, down by 17% compared to last year.

Yet, the value of these deals increased by 26%, totaling $9.026 billion. Chile’s focus on sectors like renewable energy is drawing attention from investors looking for sustainable opportunities.

Argentina rounds out the top five markets with 187 transactions, a decrease of 7%. However, Argentina saw a remarkable increase of 54% in capital mobilized, reaching $3.895 billion. This growth indicates strategic investments aimed at revitalizing key industries.

The decline in transaction volume across these countries highlights several challenges facing businesses today. Economic uncertainty and inflation have made companies more cautious about pursuing deals.

This article was produced by The Rio Times’ automated newsroom system. How we use AI · Report an error

Read More from The Rio Times

The Rio Times · Power Map
See who really holds power in Latin America
Click to open the Power Map

Rotate for Best Experience

This report is optimized for landscape viewing. Rotate your phone for the full experience.