India Quits the Sugar Trade for Years, Handing Brazil the Gap

Commodities
Key Facts
The India sugar export ban has quietly removed the world’s second-biggest seller from the market for years, and the biggest beneficiary sits in the cane fields of central Brazil.
One of the two giants of the global sugar trade is stepping off the field. India, long the world’s number-two exporter, is not expected to ship meaningful volumes abroad for at least three years.
That is a structural shift, not a seasonal blip. And it points directly at Brazil, the country that already dominates the trade and stands to gain the most.
What the India sugar export ban changes
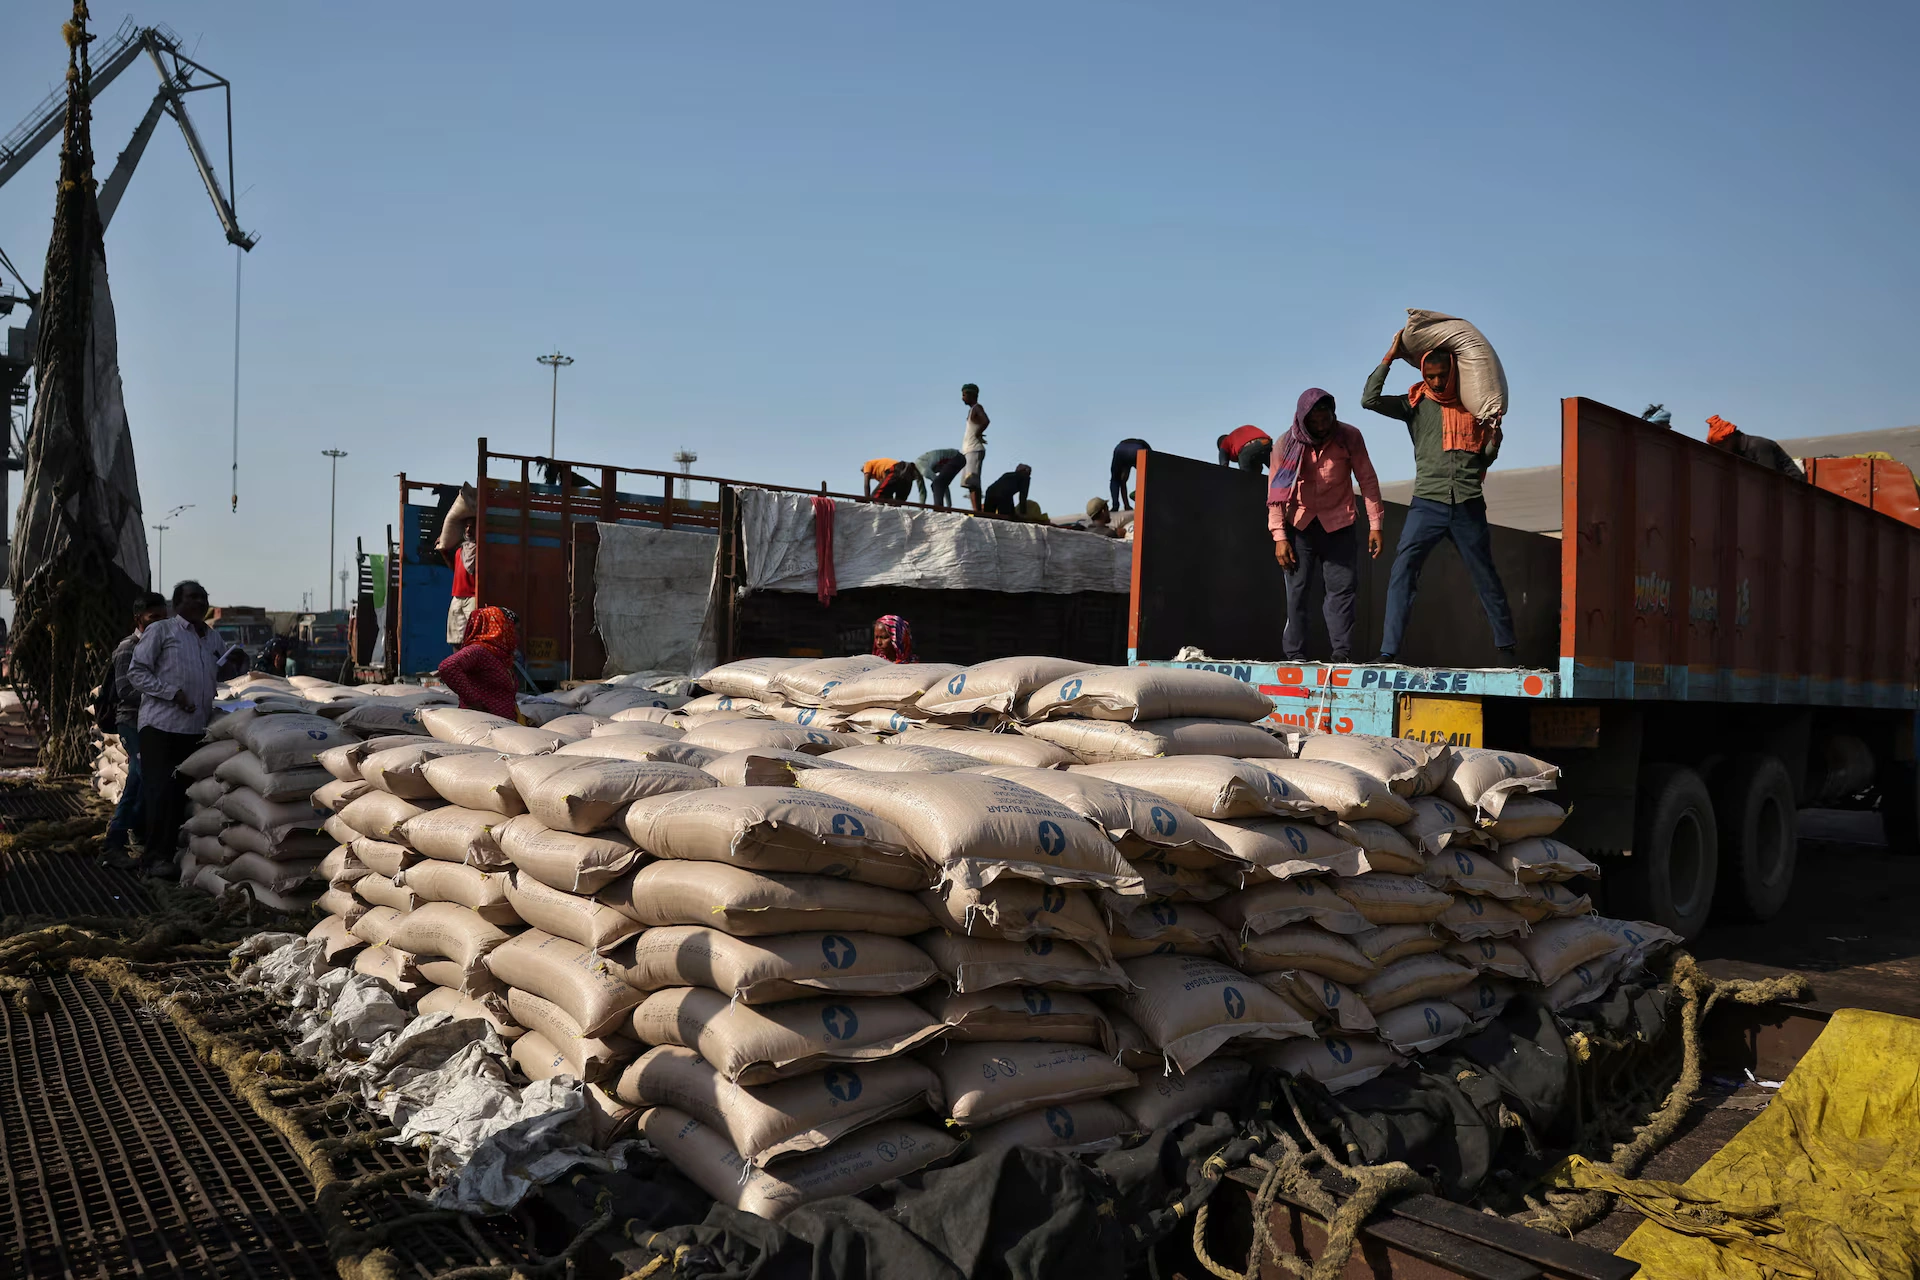
On May 14, India froze all sugar exports, placing raw, white and refined sugar in a prohibited category until the end of September. It had shipped only around eight hundred thousand tonnes this season before the door shut.
To grasp the scale, look at what India used to send out. Over the five seasons to 2022 and 2023 it exported about six and a half to seven million tonnes a year.
That was roughly a tenth of all the sugar that crosses borders. Removing it leaves a real hole in global supply for buyers across Asia, Africa and the Middle East.
Reuters reported this week that New Delhi is likely to keep withholding export permits season after season, rather than announce a single multi-year ban. The practical effect is the same: India is out.
Why India is leaving the market
Two forces are pushing in the same direction. The first is fuel.
India has been diverting more and more of its sugarcane into ethanol, the alcohol blended into petrol to cut its oil import bill.
The country hit a twenty percent ethanol blend in 2025, years ahead of its own target. Guaranteed, government-backed ethanol prices now give mills a steadier income than the swings of the export market.
The second force is the weather. A developing El Niño threatens to weaken the monsoon rains that India’s cane crop depends on, raising the risk of poor harvests for seasons to come.
The numbers already show the squeeze. India’s output this season is now seen near twenty-eight million tonnes, below its own annual consumption, with mill stocks heading for their lowest in more than three decades.
Live Company IntelligenceGrupo Aeroportuario del Pacífico S.A.B. de C.V — the full investor dossier
Valuation & profitability
Price & risk
$338.3552-wk high
$512.65
Revenue trend · 6y
Ownership
Dividend
Why Brazil is the winner
When a major supplier vanishes, buyers go to whoever is left with volume. That is overwhelmingly Brazil, which alone accounts for more than a third of the world’s traded sugar.
Industry voices in India are blunt about it: buyers across Asia, Africa and the Middle East are already turning to Brazil and, to a lesser degree, Thailand. A rival is gone for years, and the orders flow south.
For Brazil that means firmer prices and steadier demand, a welcome shift after a stretch of weak sugar prices. It strengthens the hand of an export machine built on efficient farms and flexible mills.
It also tightens the world’s reliance on a single source. With India sidelined, any shock to Brazil’s crop or its ports now matters far more to global prices than it did before.
The catch for investors
There is a complication that stops this being a simple win. Brazil’s own cane growers have spent the past year cutting back, trimming fertiliser and field renewal as costs rose and sugar prices stayed low.
Cane responds slowly, over multiple harvests, so today’s underinvestment can quietly cap tomorrow’s output. The supply that buyers want may not expand as fast as the gap India leaves behind.
Brazilian mills also face the same fork in the road as India: turn cane into sugar, or into ethanol. When fuel pays better, sugar volumes can shrink even in a country flush with cane.
For an investor, the read is a structurally tighter sugar market with Brazil as the swing supplier. That setup favours higher prices, but it also concentrates the risk in one country’s weather, ports and fuel economics.
Frequently Asked Questions
What is the India sugar export ban?
On May 14, 2026, India prohibited all sugar exports until the end of September to protect domestic supplies. Analysts and government sources now expect India, formerly the world’s second-largest exporter, to stay out of the export market for at least three years as it diverts cane to ethanol and braces for weaker harvests.
Why does this help Brazil?
Brazil already supplies more than a third of the world’s traded sugar, so buyers losing access to Indian sugar turn to it first. The removal of a major competitor for several years means firmer prices and steadier demand for Brazilian exporters, after a period of weak sugar prices.
What is the risk to the outlook?
Brazil’s growers have been cutting investment, and mills can divert cane to ethanol when fuel is more profitable, both of which limit how fast supply can grow. With India sidelined, the world depends more heavily on Brazil, so any disruption to its crop or ports would hit global prices harder.
Connected Coverage
This article was produced by The Rio Times’ automated newsroom system. How we use AI · Report an error · Editorial responsibility: Matthias Camenzind, Editor-in-Chief