Illegal Trade in Argentina Now Tops US$32 Billion a Year, About 5% of GDP
Economy · Argentina
Key Facts
—The size. Illegal trade in Argentina reaches about US$32 billion annually, equal to some 5.5% of GDP.
—The source. The estimate comes from the Argentine Chamber of Commerce and Services (CAC) with consultancy PwC.
—The lost tax. The state forgoes roughly US$8.5 billion a year in taxes and contributions.
—The sectors. Food and beverages, alcohol, cigarettes and clothing are the hardest-hit categories.
—The drivers. High tax pressure, weak border and port controls and a wide exchange-rate gap fuel smuggling and counterfeiting.
Illegal trade in Argentina now moves around US$32 billion a year, roughly 5% of the economy, a study finds, draining billions in tax revenue and undercutting the country’s formal businesses.
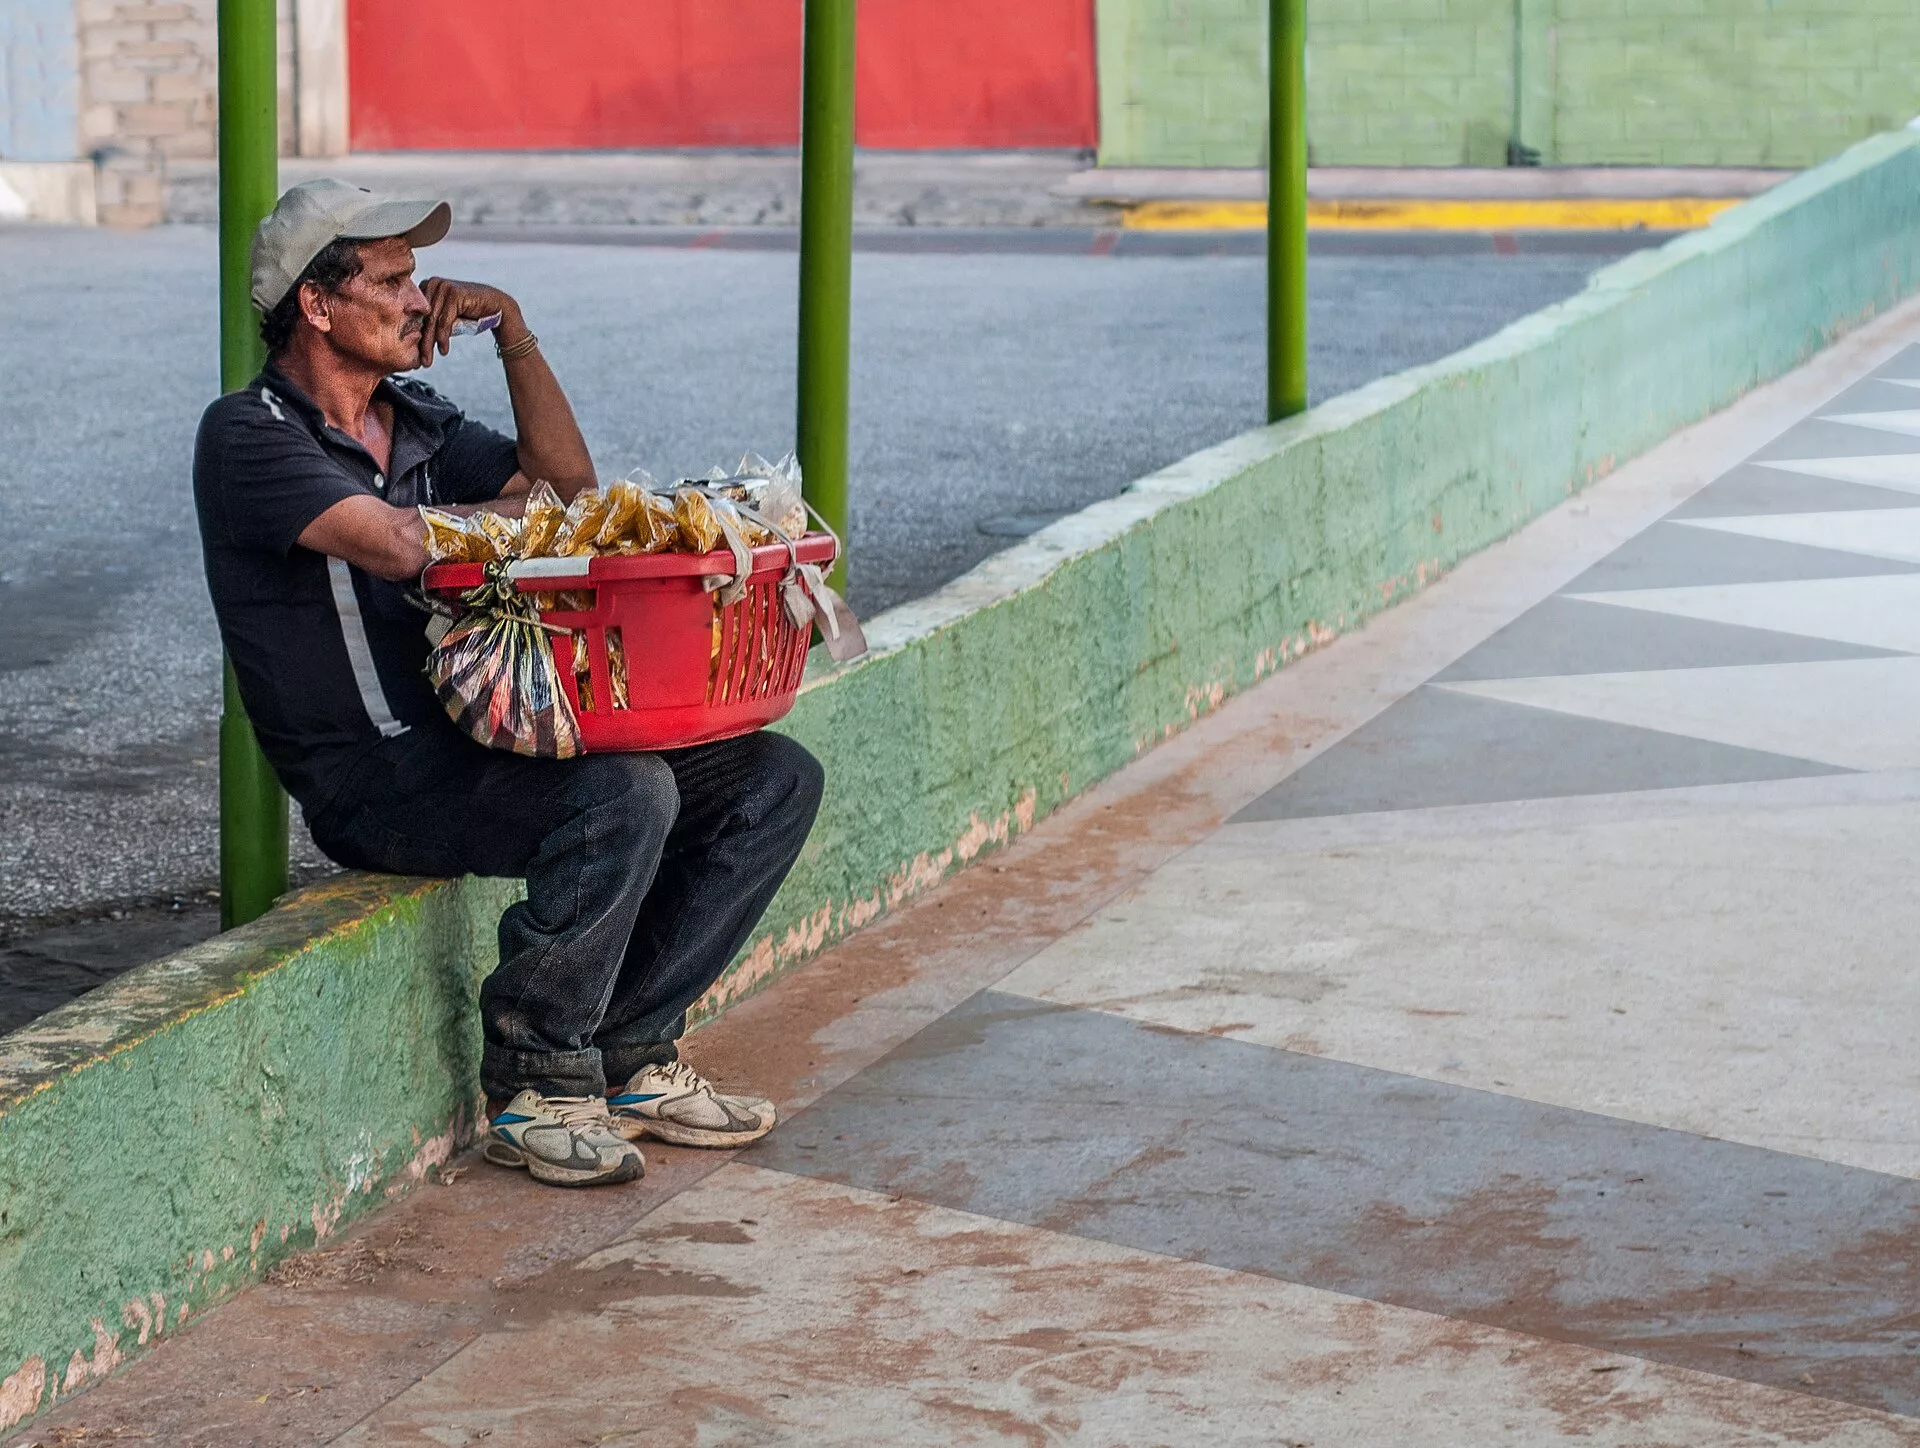
A Shadow Economy the Size of a Sector
Argentina’s illegal trade has swelled to about US$32 billion a year, on estimates from the CAC and PwC. That is equivalent to roughly 5.5% of GDP, larger than several formal industries.
The figure captures both smuggling and counterfeiting. It is money that flows outside the tax system and beyond regulatory reach.
To understand why this matters, it helps to think of GDP as the total value of all goods and services a country produces in a year. When a slice as large as 5.5% operates in the shadows, it means a significant part of everyday commerce—from the clothes people wear to the food they buy—is happening without official oversight, quality checks, or tax receipts.
For a foreign reader unfamiliar with Argentina’s economic structure, this shadow economy is not a niche problem. It is a parallel system that competes directly with registered shops, factories, and importers, often by undercutting their prices because it skips the costs that legal businesses must bear.
What It Costs the State
The fiscal hole is substantial: about US$8.5 billion a year in uncollected taxes and contributions. In a country fighting to balance its budget, that is a meaningful leak.
Every peso sold off the books also erodes the competitiveness of firms that do pay. The result is a vicious circle in which the formal sector shrinks as the informal one grows.
The lost contributions are especially painful because they include social security and healthcare payments that would otherwise fund public services. When a business sells goods informally, it typically does not register its workers either, which deepens inequality and leaves families without a safety net.
This dynamic also complicates the government’s relationship with international lenders and investors. A tax base eroded by illicit trade makes it harder to meet fiscal targets, which in turn can affect Argentina’s access to credit and the cost of borrowing on global markets.
Where the Illicit Trade Concentrates
Food and beverages, alcohol, cigarettes and clothing top the list of affected categories. These are high-volume consumer goods where price differences and easy resale make evasion attractive.
The report ties the surge to structural pressures: heavy taxation, porous borders and ports, and a persistent gap between official and parallel exchange rates. Together they tilt incentives toward the black market.
The exchange-rate gap deserves a closer look because it is a distinctly Argentine feature. For years, the country has had an official peso-dollar rate set by the central bank and a much weaker parallel rate used in informal transactions. When importers can access dollars at the cheaper official rate but sell goods at prices that reflect the parallel rate, the profit margin balloons—and so does the temptation to smuggle goods in or out without declaring them.
Weak border and port controls compound the problem. Argentina shares long land borders with several neighbors, and its busy ports handle enormous container traffic. Without robust scanning technology and enough inspectors, illicit shipments of cigarettes, electronics, and branded clothing can slip through, often disguised as legitimate cargo.
The Regional Picture
Argentina is not alone. In Brazil, illicit trade is estimated at about 4% of GDP, over US$85 billion, while in Mexico it reached 8.8% in 2023 and could climb further.
For investors and formal businesses, the scale is a warning about the cost of doing things by the book in the region. Narrowing the gap depends on stronger enforcement and a smaller price wedge between legal and illegal goods.
Placing Argentina alongside Brazil and Mexico shows that illicit trade is not an isolated quirk but a regional challenge tied to common threads: complex tax codes, uneven enforcement capacity, and large informal labor markets. Each country’s figure reflects its own regulatory environment, yet the pattern is consistent enough that multinational companies often factor shadow-economy risks into their Latin American strategies.
What to watch next is whether Argentine authorities pair enforcement with tax simplification. A crackdown on smuggling can deliver short-term results, but if the underlying price gap persists, illicit traders tend to adapt quickly. The open question is whether the government will adjust the exchange-rate policy or reduce the tax burden on the hardest-hit sectors to shrink the profit advantage that fuels the black market. Another unknown is how regional cooperation might evolve, since illicit supply chains rarely stop at national borders.
Frequently Asked Questions
How big is illegal trade in Argentina?
A CAC-PwC study estimates illegal trade at about US$32 billion a year, roughly 5.5% of GDP, larger than several formal economic sectors.
How much tax does the state lose?
Argentina forgoes roughly US$8.5 billion a year in taxes and contributions to illicit trade, according to the study.
Which sectors are most affected?
Food and beverages, alcohol, cigarettes and clothing are the hardest hit, driven by high taxes, weak border controls and the exchange-rate gap.
Sources
In depth
Read More from The Rio Times