Gambia Runs on Money Sent Home. Last Year That Was US$872 Million
GAMBIA · ECONOMY
Key Facts
- —The record Gambians abroad sent home US$872.1 million in 2025, up 12.4% on the year, the central bank reported in February 2026.
- —The scale Remittances were 31.5% of GDP in 2024, the most recent year for which a verified share exists. That is larger than tourism and goods exports combined.
- —Watch the figure US$775.6 million was the 2024 total, and US$638.4 million covers only January to September 2025. Both are circulating as if they were the 2025 annual number.
- —Prices Headline inflation fell to 6.4% in January 2026, from 6.6% in December 2025 and 7.5% in July 2025.
- —Money The policy rate was cut to 14.0% in February 2026, after 16.0% in December and 17.0% in September 2025.
- —The buffer The central bank puts reserves at 4.4 months of import cover. The IMF puts 2025 import cover at 3.9 months.
- —Foreign capital Direct investment inflows were about US$267 million in 2025, up 14.7%, on UNCTAD figures.
The Gambia is a river, its banks and a diaspora. Remittances now exceed tourism and exports combined, which is a strength and a single point of failure at the same time.
Get the Number Right First
The Gambia’s 2025 remittance total is US$872.1 million, an increase of 12.4%. The Central Bank of The Gambia published it after its monetary policy meeting of 25 and 26 February 2026.
Three other figures are in circulation and each is wrong as an annual 2025 number. US$775.6 million is the 2024 total. US$638.4 million covers only January to September 2025. US$217.8 million is a single quarter.
The distinction is not pedantry. The gap between the correct figure and the most commonly quoted alternative is nearly US$100 million in an economy whose entire annual direct investment inflow is about US$267 million.
On the growth rate, the central bank’s own release says 12.4%. Several write-ups render it as 12.5%. Use the central bank figure.
The verified increase over 2024 is US$96.42 million, which independent fact-checkers have confirmed against the central bank’s own remittance data portal.
What Remittances Actually Do Here
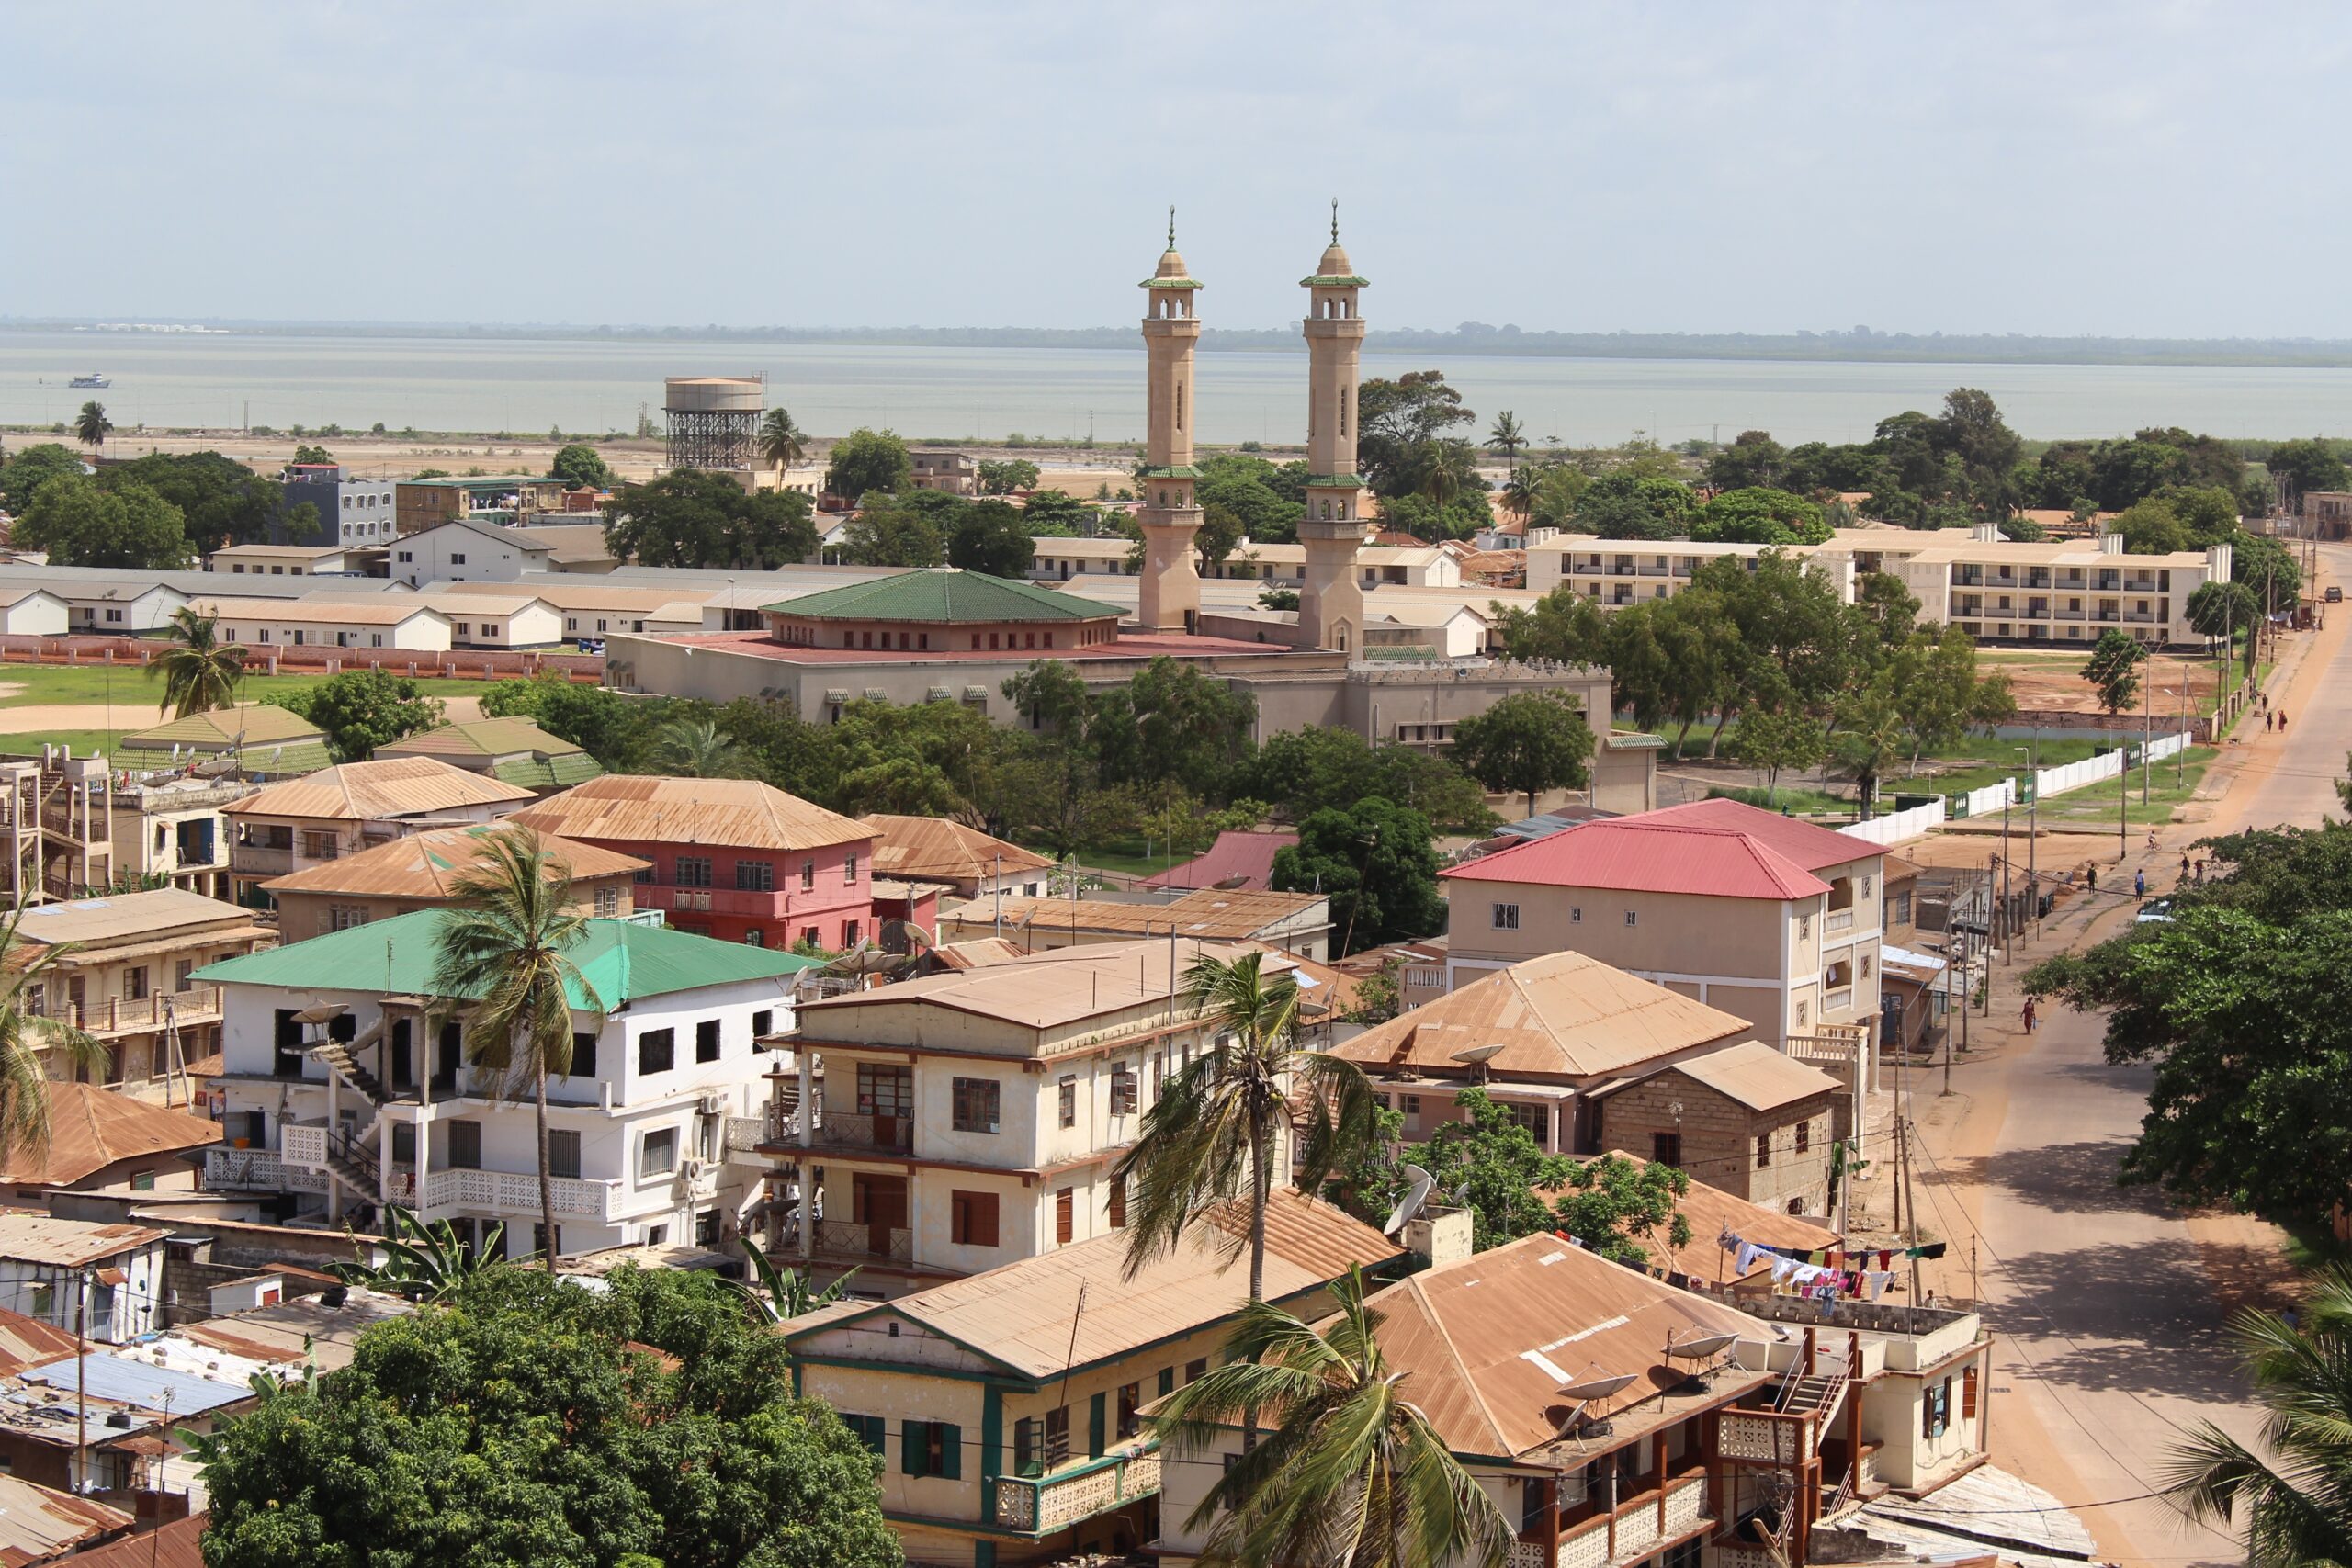
The Gambia is a services and transfers economy rather than a production one. Three things carry it: money sent home by the diaspora, tourism, and re-export trade through Banjul into the sub-region.
Agriculture, principally groundnuts and rice, employs a large share of the population. It contributes far less foreign exchange, and it is constrained by climate variability, limited irrigation and weak value chains.
Against that, remittances are not a supplement. At 31.5% of GDP in 2024 they were larger than tourism and goods exports combined. They arrive as household income rather than as investment capital, which is why they show up in consumption and imports.
A caution on the share. The only precise, institutionally sourced percentage is that 31.5% for 2024. No institution has published a 2025 share, and the underlying series has a break: 62.9% in 2021, 60% in 2022, then 26.3% in 2023 and 31.5% in 2024.
That break is consistent with a rebasing of GDP. Percentages either side of it are not comparable, which is why a widely circulated claim that remittances exceed a third of GDP should be treated carefully.
A Genuine Stabilisation, With Four Sets of Books
The macro picture improved materially in 2025 and 2026, and the improvement is not in doubt.
Headline inflation fell from 7.5% in July 2025 to 7.0% in October, 6.6% in December and 6.4% in January 2026. The central bank cut its policy rate three times over nine months, from 17.0% to 14.0%.
The IMF completed the 2026 Article IV consultation on 6 July 2026, together with the fifth review of the Extended Credit Facility and the second review of the resilience arrangement. It disbursed SDR 16.58 million, about US$22.51 million, augmented access and extended the arrangement by six months.
Growth is where the institutions begin to diverge. The central bank says 6.4% for 2025. The African Development Bank says 6.1%. The IMF projected 6.0%. The World Bank says 5.9%.
On debt the divergence is wider and matters more. The World Bank puts public debt at 76.4% of GDP for 2025. The IMF puts it at 66.9%. The African Development Bank cites about 78% at end-2024. None of the three explains the difference.
Reserve cover splits the same way. The central bank states 4.4 months of prospective import cover as of February 2026. The IMF’s December 2025 report puts 2025 import cover at 3.9 months.
The current account deficit is reported at 3.2% of GDP by the central bank, 4.9% by the African Development Bank, 5.0% by the IMF and 5.1% by the World Bank. Attribute every one of these figures to whoever published it.
What This Means If You Move Money or Invest
The dalasi floats. There is no peg and no currency board. The central bank publishes a daily rate, and on 19 September 2026 it was 72.63 dalasi to the dollar and 85.22 to the euro.
Recent stability is real but recent. The dalasi depreciated about 5.8% against the dollar in the first half of 2025, then steadied. It lost 0.5% in the fourth quarter and gained 0.1% against the dollar between June and September 2025.
A caution on repatriation. The Gambia Investment and Export Promotion Agency publishes its incentive schedule, but makes no explicit statement on profit or capital repatriation rights. We could not obtain the standard investment climate assessment that normally covers this.
That is a genuine gap rather than a reassuring silence. Anyone structuring an investment should check repatriation terms with the agency and a local adviser directly, rather than assuming them.
The incentives themselves are documented. A Special Investment Certificate requires a minimum of US$250,000 from a foreign investor, or US$100,000 from a domestic one, in priority sectors or regions.
It carries an income tax exemption of five years in priority sectors, or eight years in priority regions. Import duty on capital goods is exempt, import value added tax is exempt for five years, and buildings attract a 15% annual depreciation allowance.
Priority sectors are agriculture, fisheries, tourism, forestry, manufacturing, energy and certain services. Priority regions are West Coast, Lower River, North Bank, Central River and Upper River.
The banking system is small but sound on the headline measures. Capital adequacy is around 29% and private sector credit grew about 8%, on African Development Bank figures from June 2026.
The Risk Nobody Prices
A remittance economy has one exposure that a commodity economy does not, and it is rarely discussed in the financial press.
Commodity revenues fall when prices fall. Remittance revenues fall when migration conditions in the destination country change, which is a political variable rather than a market one, and it moves without warning.
The Gambia’s diaspora is concentrated in Europe and the United States. A tightening of residency or work rules in either would reduce the flow directly, and there is no domestic policy lever that offsets it.
That is the reason the export base matters even though it is small. Import cover of roughly four months against a chronic current account deficit leaves limited room to absorb a shock, and the country is assessed at high risk of debt distress.
There is also an open question about what the 2025 record actually represents. Remittances may have grown because diaspora earnings grew. They may equally have grown because money that previously moved informally now moves through mobile money and formal channels, and is therefore counted for the first time.
No institution has decomposed it. The distinction determines whether the record is a trend or a measurement effect, and it is the single most useful thing anyone could publish about this economy.
On the more encouraging side, extreme poverty fell to 20.3% in 2025 from 21.5% in 2024, and the fiscal deficit including grants narrowed to 1.3% of GDP from 4.0%.
What Is Not Known
What share of GDP remittances represented in 2025. No institution has published one, and the rebasing break in the series makes an estimate unsafe.
Why the IMF and World Bank differ by about 9.5 percentage points on 2025 public debt, at 66.9% against 76.4%, and which basis the 2026 Article IV finally adopted.
Whether the record 2025 inflow reflects genuine growth in diaspora earnings or a shift from informal to formal channels. No institution has decomposed it.
The current level of gross reserves in dollars. The central bank has not published a dollar level since end-October 2025, when it was US$493.11 million, and reports only the cover ratio since.
Profit and capital repatriation rules. The Gambia Investment and Export Promotion Agency’s published incentive material does not address them, and the standard investment climate assessment was not obtainable.
Connected Coverage
- Taxes in Ghana for Expats 2026: Residency Can Raise Your Rate
- Kenya Residency Visa Requirements 2026: Class K Starts at 35
- Open a Bank Account in Kenya as a Foreigner, Step by Step
Sources
- Central Bank of The Gambia — Monetary Policy Committee releases and daily exchange rates
- IMF — Executive Board concludes the 2026 Article IV consultation with The Gambia, 6 July 2026
- World Bank — The Gambia country overview
- African Development Bank — Gambia economic outlook
- Gambia Investment and Export Promotion Agency — investment incentives
Frequently Asked Questions
How much did Gambians abroad send home in 2025?
US$872.1 million, up 12.4% on 2024, according to the Central Bank of The Gambia. The 2024 total was US$775.6 million. A figure of US$638.4 million that circulates widely covers only January to September 2025.
What share of The Gambia’s economy is remittances?
Remittances were 31.5% of GDP in 2024, the most recent verified share. No institution has published a 2025 figure, and a rebasing break in the series means older percentages are not comparable with newer ones.
What is the exchange rate for the Gambian dalasi?
The central bank published 72.63 dalasi to the US dollar and 85.22 to the euro on 19 September 2026. The dalasi floats freely, with no peg, and depreciated about 5.8% against the dollar in the first half of 2025 before steadying.
What do foreign investors need to qualify for Gambian incentives?
A Special Investment Certificate requires a minimum of US$250,000 from a foreign investor in a priority sector or region. It carries five to eight years of income tax exemption, import duty exemption on capital goods and five years of import VAT exemption.
Is The Gambia’s debt sustainable?
The country is assessed at high risk of debt distress. The institutions disagree on the level: the World Bank puts public debt at 76.4% of GDP for 2025 and the IMF at 66.9%, a gap neither has explained.
This article was produced by The Rio Times’ automated newsroom system. How we use AI · Report an error
Read More from The Rio Times