IBOV 204,302.33 ▼ 0.74% IPSA 10,999.64 ▼ 1.47% IPC MEX 64,460.91 ▼ 1.30% MERVAL 2,824,123 ▼ 2.51% COLCAP 2,534.92 ▼ 2.09% BVL PERÚ 60,766.81 ▼ 1.71% USD/BRL5.02▲ 0.80% USD/MXN17.97▼ 0.08% USD/CLP978.61▲ 0.60% USD/COP3,240▲ 0.99% USD/PEN3.44▼ 0.06% USD/ARS1,517▼ 0.24% USD/UYU40.09▲ 2.39% USD/PYG5,835▲ 3.05% USD/BOB11.87▲ 2.15% USD/DOP60.29▲ 3.70% USD/CRC453.46▲ 2.32% USD/GTQ7.64▲ 3.39% USD/HNL26.86▲ 0.86% USD/NIO36.62▲ 0.26% USD/VES871.68▼ 0.13% USD/PAB1.00— 0.00% USD/BZD2.00— 0.00% USD/JMD 157.28 — 0.00% USD/TTD6.70▲ 2.23% EUR/BRL5.62▲ 0.33% BRENT 88.88 ▼ 0.03% WTI 83.11 ▼ 0.11% IRON ORE 161.91 — — COPPER 6.61 ▲ 0.03% GOLD 4,461 ▲ 1.78% SILVER 65.59 ▲ 1.26% SOY 1,184 ▲ 3.20% CORN 480.50 ▲ 10.02% WHEAT 655.00 ▲ 3.93% COFFEE 317.25 ▼ 5.51% SUGAR 16.43 ▼ 1.79% ORANGE JUICE 138.55 ▼ 0.47% COTTON 85.03 ▲ 2.33% COCOA 5,719 ▲ 3.18% BEEF 223.60 ▼ 3.93% CATTLE 339.10 ▼ 3.16% LITHIUM 75.20 ▲ 1.47% PETR4 41.64 ▼ 0.05% VALE3 72.97 ▲ 0.83% ITUB4 38.60 ▼ 1.03% BBDC4 16.85 ▲ 0.36% ABEV3 14.89 ▼ 0.80% BBAS3 19.37 ▲ 0.47% B3SA3 14.26 ▼ 0.21% WEGE3 47.59 ▲ 0.49% PRIO3 59.14 ▼ 0.19% SUZB3 41.33 ▲ 2.35% RENT3 34.68 ▼ 0.09% AZZA3 15.89 ▼ 2.63% CSAN3 3.22 ▼ 1.83% RAIZ4 0.25 — 0.00% PCAR3 2.75 ▼ 0.36% GMAT3 3.65 ▼ 1.08% PSSA3 48.13 ▼ 0.54% CVCB3 1.33 ▼ 2.92% POSI3 3.36 ▲ 2.44% SLCE3 13.34 ▲ 0.30% NATU3 8.14 ▼ 0.73% IBOV 204,302.33 ▼ 0.74% IPSA 10,999.64 ▼ 1.47% IPC MEX 64,460.91 ▼ 1.30% MERVAL 2,824,123 ▼ 2.51% COLCAP 2,534.92 ▼ 2.09% BVL PERÚ 60,766.81 ▼ 1.71% USD/BRL 5.16 ▲ 0.01% USD/MXN 17.06 ▼ 0.24% USD/CLP 913.98 ▲ 0.04% USD/COP 3,140 ▲ 0.03% USD/PEN 3.36 ▼ 0.66% USD/ARS 1,493 ▲ 0.10% USD/UYU 40.27 ▲ 1.24% USD/PYG 5,939 ▲ 1.68% USD/BOB 11.64 ▼ 0.76% USD/DOP 58.34 ▲ 1.25% USD/CRC 445.92 ▲ 0.89% USD/GTQ 7.62 ▲ 2.21% USD/HNL 26.79 ▲ 1.57% USD/NIO 36.62 ▲ 0.69% USD/VES 762.44 ▼ 0.13% USD/PAB 1.00 — 0.00% USD/BZD 2.00 — 0.00% USD/JMD 157.28 — 0.00% USD/TTD 6.70 ▲ 0.61% EUR/BRL 5.95 ▲ 1.01% BRENT 88.88 ▼ 0.03% WTI 83.11 ▼ 0.11% IRON ORE 161.91 — — COPPER 6.61 ▲ 0.03% GOLD 4,461 ▲ 1.78% SILVER 65.59 ▲ 1.26% SOY 1,184 ▲ 3.20% CORN 480.50 ▲ 10.02% WHEAT 655.00 ▲ 3.93% COFFEE 317.25 ▼ 5.51% SUGAR 16.43 ▼ 1.79% ORANGE JUICE 138.55 ▼ 0.47% COTTON 85.03 ▲ 2.33% COCOA 5,719 ▲ 3.18% BEEF 223.60 ▼ 3.93% CATTLE 339.10 ▼ 3.16% LITHIUM 75.20 ▲ 1.47% PETR4 41.64 ▼ 0.05% VALE3 72.97 ▲ 0.83% ITUB4 38.60 ▼ 1.03% BBDC4 16.85 ▲ 0.36% ABEV3 14.89 ▼ 0.80% BBAS3 19.37 ▲ 0.47% B3SA3 14.26 ▼ 0.21% WEGE3 47.59 ▲ 0.49% PRIO3 59.14 ▼ 0.19% SUZB3 41.33 ▲ 2.35% RENT3 34.68 ▼ 0.09% AZZA3 15.89 ▼ 2.63% CSAN3 3.22 ▼ 1.83% RAIZ4 0.25 — 0.00% PCAR3 2.75 ▼ 0.36% GMAT3 3.65 ▼ 1.08% PSSA3 48.13 ▼ 0.54% CVCB3 1.33 ▼ 2.92% POSI3 3.36 ▲ 2.44% SLCE3 13.34 ▲ 0.30% NATU3 8.14 ▼ 0.73%
since 2009
Wednesday, October 7, 2026

World-News North America

Factory Growth Surges: Strongest U.S. Manufacturing Reading Since Mid-2022

By · August 21, 2025 · 2 min read

The latest business surveys confirm that American manufacturing is no longer in retreat but moving into a new growth phase. The national Manufacturing PMI rose sharply in August to 53.3, up from 49.8 in July.

This marks the sector’s strongest performance since mid-2022. Services activity also held firm at 55.4, while the Composite Output Index matched that pace at 55.4, signaling broad private-sector expansion across goods and services.

The data shows that industrial production is once again pulling its weight. New orders improved, production picked up, and investment commitments gained traction.

Companies are signaling confidence by raising spending on equipment and capacity. This represents a reversal from the stagnation that marked much of the past three years and aligns with deliberate efforts to rebuild the nation’s industrial base.

New York delivered an even more striking confirmation. Its Empire State Manufacturing Index jumped to 11.9 in August, more than doubling the previous month’s level.
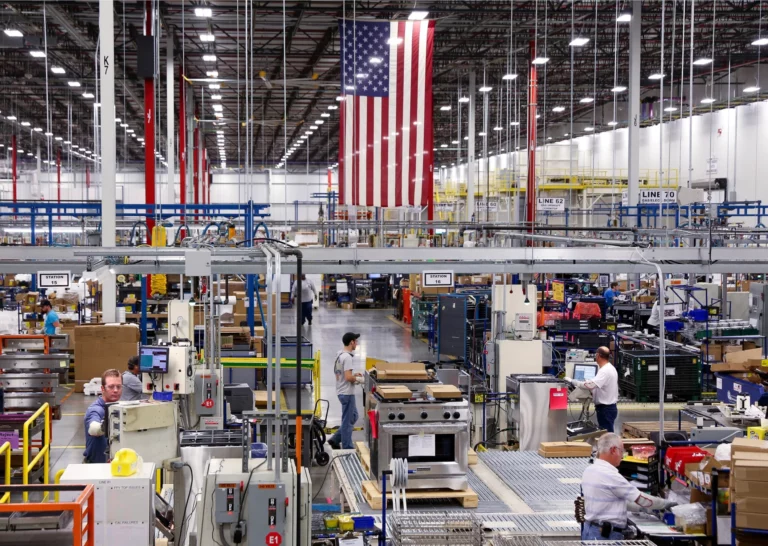
Factory Growth Surges: Strongest U.S. Manufacturing Reading Since Mid-2022
Factory Growth Surges: Strongest U.S. Manufacturing Reading Since Mid-2022.
RT
Ask Rio Times
17 years of Latin America reporting, on demand.
Open the full Ask Rio Times →

That region has historically served as a bellwether for national conditions, and its sudden acceleration underscores the shift taking place on the factory floor.

The LatAm Brief

One email, every weekday morning. What moved in Latin American markets, politics and expat life.

Yesterday’s subject line: “Mexico sells record US$60.6bn to the US in August”

Free. We send a confirmation link first — nothing arrives until you click it. Unsubscribe with one click in any edition. If you stop opening us for 30 days we stop sending by ourselves, as we assume the interest is no longer there. See our privacy policy. We never share your email.

At the same time, capital expenditure indexes in regional surveys moved sharply higher. Businesses are committing to new plants, machinery, and logistics improvements, which suggests this is not a short-lived rebound.

It reflects a broader realignment, driven by policies that favor domestic production and shield critical sectors from external shocks. This momentum comes as global conditions remain uneven.

Europe’s industrial sector is struggling to gain ground, with its composite output only marginally above neutral and Germany’s manufacturing still in contraction.

Asia shows mixed results, with some export-driven economies slowing. Against that backdrop, the United States is standing out as a hub of renewed industrial vitality.

Housing markets add to the picture of stability. Existing home sales rose by 2.0% in July, suggesting households are maintaining demand despite higher costs of credit.

Together with rising output figures, these signs suggest that domestic demand and production are reinforcing each other. The underlying story is not just about month-to-month fluctuations.

It is about a shift in direction: a manufacturing revival built on reshoring, investment, and strategic protection of supply chains. The numbers point to a U.S. economy that is regaining strength where it matters most—on the factory floor.

This article was produced by The Rio Times’ automated newsroom system. How we use AI · Report an error · Editorial responsibility: Matthias Camenzind, Editor-in-Chief

The Rio Times · Power Map
See who really holds power in Latin America
Click to open the Power Map →

Rotate for Best Experience

This report is optimized for landscape viewing. Rotate your phone for the full experience.