IBOV 174,041.95 ▼ 1.52% IPSA 10,950.74 ▲ 0.31% IPC MEX 66,383.68 ▲ 0.21% MERVAL 3,283,854 ▼ 1.07% COLCAP 2,274.53 ▼ 0.38% BVL PERÚ 58,287.01 — — USD/BRL5.08▼ 0.24% USD/MXN17.48▼ 0.26% USD/CLP 948.45 — 0.00% USD/COP3,218▲ 0.16% USD/PEN3.40▲ 0.13% USD/ARS1,496▲ 0.47% USD/UYU40.14▲ 1.38% USD/PYG6,022▲ 1.26% USD/BOB11.18▲ 4.51% USD/DOP57.99▼ 0.28% USD/CRC449.17▲ 1.76% USD/GTQ7.63▲ 2.33% USD/HNL26.75▲ 0.82% USD/NIO36.62▲ 0.51% USD/VES740.37▼ 0.13% USD/PAB1.00— 0.00% USD/BZD2.00— 0.00% USD/JMD157.29▲ 0.11% USD/TTD6.71▲ 0.92% EUR/BRL5.78▲ 0.08% BRENT 96.78 ▼ 3.88% WTI 89.31 ▼ 3.12% IRON ORE 161.91 — — COPPER 6.36 ▲ 0.83% GOLD 4,071 ▲ 0.60% SILVER 58.91 ▲ 1.92% SOY 1,254 ▲ 1.29% CORN 487.25 ▲ 5.01% WHEAT 678.00 ▼ 2.62% COFFEE 298.25 ▼ 3.60% SUGAR 14.76 ▲ 0.48% ORANGE JUICE 142.65 ▼ 2.83% COTTON 79.89 ▲ 0.06% COCOA 5,467 ▲ 3.13% BEEF 222.50 ▼ 1.29% CATTLE 341.45 ▼ 0.68% LITHIUM 67.81 ▼ 1.75% PETR4 42.21 ▼ 1.72% VALE3 75.24 ▼ 0.58% ITUB4 42.10 ▼ 1.08% BBDC4 18.48 ▼ 1.28% ABEV3 15.64 ▼ 1.76% BBAS3 20.35 ▼ 2.77% B3SA3 15.44 ▼ 1.34% WEGE3 45.99 ▲ 0.70% PRIO3 58.82 ▼ 2.84% SUZB3 41.84 ▼ 1.39% RENT3 36.89 ▼ 0.67% AZZA3 16.65 ▼ 2.35% CSAN3 3.80 ▼ 2.56% RAIZ4 0.26 ▼ 3.70% PCAR3 2.79 ▼ 2.79% GMAT3 3.79 ▼ 2.07% PSSA3 54.78 ▼ 0.72% CVCB3 1.34 ▲ 2.29% POSI3 3.55 ▼ 3.27% SLCE3 13.64 ▼ 0.94% NATU3 8.38 ▼ 2.10% BRKM5 6.10 ▼ 1.13% RANI3 7.95 ▲ 0.25% CSNA3 5.36 ▲ 1.13% CMIN3 5.69 ▼ 2.40% USIM5 8.48 ▼ 0.12% GGBR4 24.26 ▲ 0.83% ENEV3 24.90 ▼ 3.11% CPFE3 45.09 ▼ 2.44% CMIG4 10.98 ▼ 1.88% EQTL3 38.34 ▼ 1.74% LREN3 13.27 ▼ 0.75% VIVT3 35.47 ▲ 2.22% RAIL3 13.57 ▼ 2.79% KLABIN 17.52 ▼ 0.79% RAIA DROGASIL 17.98 ▼ 1.15% RDOR3 33.38 ▼ 0.86% HAPV3 9.92 ▼ 5.25% FLRY3 16.26 ▼ 1.93% SMTO3 15.05 ▼ 4.20% UGPA3 32.71 ▼ 2.04% VBBR3 35.10 ▼ 1.40% BBSE3 41.49 ▼ 2.15% BPAC11 54.67 ▼ 2.90% CURY3 29.35 ▼ 0.91% AERI3 2.04 ▲ 0.99% VIVARA 21.42 ▼ 0.14% COMPASS 24.76 ▼ 1.28% VAMOS 3.15 ▼ 1.87% SANB11 26.34 ▼ 1.09% ASAI3 7.85 ▼ 2.12% SBSP3 28.38 ▼ 1.29% WALMEX 48.00 ▲ 1.39% GMEXICO 207.28 ▼ 0.94% FEMSA 221.92 ▼ 0.19% CEMEX 21.18 ▼ 1.40% GFNORTE 193.04 ▲ 2.00% BIMBO 58.26 ▼ 1.39% TELEVISA 9.73 ▼ 0.61% AMX 22.80 ▲ 0.18% GAP 377.44 ▲ 0.26% ASUR 267.99 ▼ 0.69% OMA 226.14 ▼ 0.51% KOF 179.29 ▼ 0.23% GRUMA 268.70 ▼ 0.09% KIMBER 39.70 ▲ 1.10% SQM-B 65,350 ▼ 0.23% COPEC 6,330 ▲ 1.12% BSANTANDER 79.32 ▼ 0.85% FALABELLA 5,990 ▼ 1.12% ENELAM 85.49 ▲ 0.58% CENCOSUD 1,958 ▼ 0.51% CMPC 1,025 ▼ 2.47% BANCO CHILE 193.10 ▲ 1.25% LATAM AIR 23.88 ▲ 1.62% YPF 82,000 ▼ 0.58% GGAL 7,890 ▼ 0.69% PAMPA 5,515 ▼ 2.04% TXAR 675.00 ▼ 0.74% ALUAR 972.00 ▼ 1.07% TGS 9,765 ▼ 2.30% CEPU 2,365 ▼ 2.27% MIRGOR 16,525 ▼ 1.20% COME 42.41 ▼ 0.28% LOMA NEGRA 3,623 ▼ 3.78% BYMA 299.75 ▲ 2.48% TELECOM ARG 4,380 ▲ 1.27% ECOPETROL 16.01 ▼ 1.96% BANCOLOMBIA 86.01 ▼ 0.90% GRUPO AVAL 4.79 ▼ 3.04% CREDICORP 388.77 ▲ 0.29% SOUTHERN COPPER 179.29 ▼ 1.61% BUENAVENTURA 30.91 ▼ 1.31% MERCADOLIBRE 1,801 ▲ 0.15% NUBANK 14.09 ▼ 0.70% XP 16.69 ▼ 0.83% PAGSEGURO 9.20 ▼ 2.75% STONE 10.76 ▼ 2.00% GLOBANT 31.30 ▲ 2.25% TECNOGLASS 45.30 ▲ 3.57% GAP AIRPORT 216.28 ▲ 0.39% ASUR 267.99 ▼ 0.69% OMA AIRPORT 103.43 ▼ 0.68% AMX ADR 26.01 ▲ 0.23% FEMSA ADR 127.12 ▲ 0.03% CEMEX ADR 12.06 ▼ 1.63% PETROBRAS ADR 18.77 ▼ 1.21% VALE ADR 14.79 ▼ 0.27% ITAU ADR 8.28 ▼ 0.84% SANTANDER BR 5.30 ▼ 1.21% AMBEV ADR 3.06 ▼ 0.97% CSN 1.08 ▲ 1.89% GERDAU 4.81 ▲ 0.84% LATAM ADR 50.15 ▲ 0.62% BTC 64,143 ▲ 0.07% ETH 1,867 ▲ 0.38% SOL 74.26 ▲ 0.51% XRP 1.10 ▲ 0.93% BNB 567.33 ▲ 0.53% ADA 0.17 ▲ 0.84% DOGE 0.07 ▲ 3.58% AVAX 6.69 ▲ 6.24% LINK 8.40 ▲ 0.81% DOT 0.82 ▲ 1.70% LTC 46.15 ▼ 0.38% BCH 209.80 ▼ 0.37% TRX 0.33 ▲ 0.05% XLM 0.18 ▲ 0.62% HBAR 0.07 ▼ 0.44% NEAR 1.79 ▼ 0.82% ATOM 1.38 ▼ 0.90% AAVE 91.78 ▼ 1.36% SELIC 14.25% EMBRAER 82.50 ▼ 1.08% EMBRAER ADR 64.93 ▼ 0.82% JBS 12.28 ▲ 1.24% JBS BDR 62.04 ▲ 0.36% MBRF3 14.84 ▼ 4.81% MBRFY 2.94 ▼ 0.34% INTER 5.29 ▼ 3.11% EGX 53,932 ▼ 0.11% USD/ZAR16.82▲ 0.03% USD/NGN1,363▼ 0.44% NIKKEI 64,611 ▼ 2.73% CSI300 4,649 ▼ 1.67% HSI 24,963 ▼ 0.98% NIFTY 23,767 ▼ 0.43% KOSPI 6,691 ▼ 5.72% JCI 6,196 ▼ 1.88% USD/JPY163.79▼ 0.04% USD/CNY6.76▼ 0.15% DAX 25,099 ▲ 1.36% CAC 8,372 ▲ 0.88% FTSE 10,736 ▲ 0.91% MIB 51,802 ▲ 0.95% IBEX 19,585 ▲ 1.65% STOXX 644.51 ▲ 0.82% EUR/USD1.14▼ 0.02% GBP/USD1.33▼ 0.42% SPX 7,412 ▲ 0.05% DJI 51,947 ▲ 0.46% NDX 28,128 ▼ 1.15% RUT 2,930 ▼ 0.35% TSX 35,369 ▲ 0.50% VIX 18.58 ▼ 0.64% USD/CAD1.41— 0.00% US10Y 4.6790 ▼ 0.51% IBOV 174,041.95 ▼ 1.52% IPSA 10,950.74 ▲ 0.31% IPC MEX 66,383.68 ▲ 0.21% MERVAL 3,283,854 ▼ 1.07% COLCAP 2,274.53 ▼ 0.38% BVL PERÚ 58,287.01 — — USD/BRL 5.08 ▼ 0.24% USD/MXN 17.48 ▼ 0.26% USD/CLP 948.45 — 0.00% USD/COP 3,218 ▲ 0.16% USD/PEN 3.40 ▲ 0.13% USD/ARS 1,496 ▲ 0.47% USD/UYU 40.14 ▲ 1.38% USD/PYG 6,022 ▲ 1.26% USD/BOB 11.18 ▲ 4.51% USD/DOP 57.99 ▼ 0.28% USD/CRC 449.17 ▲ 1.76% USD/GTQ 7.63 ▲ 2.33% USD/HNL 26.75 ▲ 0.82% USD/NIO 36.62 ▲ 0.51% USD/VES 740.37 ▼ 0.13% USD/PAB 1.00 — 0.00% USD/BZD 2.00 — 0.00% USD/JMD 157.29 ▲ 0.08% USD/TTD 6.71 ▲ 0.68% EUR/BRL 5.78 ▲ 0.08% BRENT 96.78 ▼ 3.88% WTI 89.31 ▼ 3.12% IRON ORE 161.91 — — COPPER 6.36 ▲ 0.83% GOLD 4,071 ▲ 0.60% SILVER 58.91 ▲ 1.92% SOY 1,254 ▲ 1.29% CORN 487.25 ▲ 5.01% WHEAT 678.00 ▼ 2.62% COFFEE 298.25 ▼ 3.60% SUGAR 14.76 ▲ 0.48% ORANGE JUICE 142.65 ▼ 2.83% COTTON 79.89 ▲ 0.06% COCOA 5,467 ▲ 3.13% BEEF 222.50 ▼ 1.29% CATTLE 341.45 ▼ 0.68% LITHIUM 67.81 ▼ 1.75% PETR4 42.21 ▼ 1.72% VALE3 75.24 ▼ 0.58% ITUB4 42.10 ▼ 1.08% BBDC4 18.48 ▼ 1.28% ABEV3 15.64 ▼ 1.76% BBAS3 20.35 ▼ 2.77% B3SA3 15.44 ▼ 1.34% WEGE3 45.99 ▲ 0.70% PRIO3 58.82 ▼ 2.84% SUZB3 41.84 ▼ 1.39% RENT3 36.89 ▼ 0.67% AZZA3 16.65 ▼ 2.35% CSAN3 3.80 ▼ 2.56% RAIZ4 0.26 ▼ 3.70% PCAR3 2.79 ▼ 2.79% GMAT3 3.79 ▼ 2.07% PSSA3 54.78 ▼ 0.72% CVCB3 1.34 ▲ 2.29% POSI3 3.55 ▼ 3.27% SLCE3 13.64 ▼ 0.94% NATU3 8.38 ▼ 2.10% BRKM5 6.10 ▼ 1.13% RANI3 7.95 ▲ 0.25% CSNA3 5.36 ▲ 1.13% CMIN3 5.69 ▼ 2.40% USIM5 8.48 ▼ 0.12% GGBR4 24.26 ▲ 0.83% ENEV3 24.90 ▼ 3.11% CPFE3 45.09 ▼ 2.44% CMIG4 10.98 ▼ 1.88% EQTL3 38.34 ▼ 1.74% LREN3 13.27 ▼ 0.75% VIVT3 35.47 ▲ 2.22% RAIL3 13.57 ▼ 2.79% KLABIN 17.52 ▼ 0.79% RAIA DROGASIL 17.98 ▼ 1.15% RDOR3 33.38 ▼ 0.86% HAPV3 9.92 ▼ 5.25% FLRY3 16.26 ▼ 1.93% SMTO3 15.05 ▼ 4.20% UGPA3 32.71 ▼ 2.04% VBBR3 35.10 ▼ 1.40% BBSE3 41.49 ▼ 2.15% BPAC11 54.67 ▼ 2.90% CURY3 29.35 ▼ 0.91% AERI3 2.04 ▲ 0.99% VIVARA 21.42 ▼ 0.14% COMPASS 24.76 ▼ 1.28% VAMOS 3.15 ▼ 1.87% SANB11 26.34 ▼ 1.09% ASAI3 7.85 ▼ 2.12% SBSP3 28.38 ▼ 1.29% WALMEX 48.00 ▲ 1.39% GMEXICO 207.28 ▼ 0.94% FEMSA 221.92 ▼ 0.19% CEMEX 21.18 ▼ 1.40% GFNORTE 193.04 ▲ 2.00% BIMBO 58.26 ▼ 1.39% TELEVISA 9.73 ▼ 0.61% AMX 22.80 ▲ 0.18% GAP 377.44 ▲ 0.26% ASUR 267.99 ▼ 0.69% OMA 226.14 ▼ 0.51% KOF 179.29 ▼ 0.23% GRUMA 268.70 ▼ 0.09% KIMBER 39.70 ▲ 1.10% SQM-B 65,350 ▼ 0.23% COPEC 6,330 ▲ 1.12% BSANTANDER 79.32 ▼ 0.85% FALABELLA 5,990 ▼ 1.12% ENELAM 85.49 ▲ 0.58% CENCOSUD 1,958 ▼ 0.51% CMPC 1,025 ▼ 2.47% BANCO CHILE 193.10 ▲ 1.25% LATAM AIR 23.88 ▲ 1.62% YPF 82,000 ▼ 0.58% GGAL 7,890 ▼ 0.69% PAMPA 5,515 ▼ 2.04% TXAR 675.00 ▼ 0.74% ALUAR 972.00 ▼ 1.07% TGS 9,765 ▼ 2.30% CEPU 2,365 ▼ 2.27% MIRGOR 16,525 ▼ 1.20% COME 42.41 ▼ 0.28% LOMA NEGRA 3,623 ▼ 3.78% BYMA 299.75 ▲ 2.48% TELECOM ARG 4,380 ▲ 1.27% ECOPETROL 16.01 ▼ 1.96% BANCOLOMBIA 86.01 ▼ 0.90% GRUPO AVAL 4.79 ▼ 3.04% CREDICORP 388.77 ▲ 0.29% SOUTHERN COPPER 179.29 ▼ 1.61% BUENAVENTURA 30.91 ▼ 1.31% MERCADOLIBRE 1,801 ▲ 0.15% NUBANK 14.09 ▼ 0.70% XP 16.69 ▼ 0.83% PAGSEGURO 9.20 ▼ 2.75% STONE 10.76 ▼ 2.00% GLOBANT 31.30 ▲ 2.25% TECNOGLASS 45.30 ▲ 3.57% GAP AIRPORT 216.28 ▲ 0.39% ASUR 267.99 ▼ 0.69% OMA AIRPORT 103.43 ▼ 0.68% AMX ADR 26.01 ▲ 0.23% FEMSA ADR 127.12 ▲ 0.03% CEMEX ADR 12.06 ▼ 1.63% PETROBRAS ADR 18.77 ▼ 1.21% VALE ADR 14.79 ▼ 0.27% ITAU ADR 8.28 ▼ 0.84% SANTANDER BR 5.30 ▼ 1.21% AMBEV ADR 3.06 ▼ 0.97% CSN 1.08 ▲ 1.89% GERDAU 4.81 ▲ 0.84% LATAM ADR 50.15 ▲ 0.62% BTC 64,143 ▲ 0.07% ETH 1,867 ▲ 0.38% SOL 74.26 ▲ 0.51% XRP 1.10 ▲ 0.93% BNB 567.33 ▲ 0.53% ADA 0.17 ▲ 0.84% DOGE 0.07 ▲ 3.58% AVAX 6.69 ▲ 6.24% LINK 8.40 ▲ 0.81% DOT 0.82 ▲ 1.70% LTC 46.15 ▼ 0.38% BCH 209.80 ▼ 0.37% TRX 0.33 ▲ 0.05% XLM 0.18 ▲ 0.62% HBAR 0.07 ▼ 0.44% NEAR 1.79 ▼ 0.82% ATOM 1.38 ▼ 0.90% AAVE 91.78 ▼ 1.36% SELIC 14.25% EMBRAER 82.50 ▼ 1.08% EMBRAER ADR 64.93 ▼ 0.82% JBS 12.28 ▲ 1.24% JBS BDR 62.04 ▲ 0.36% MBRF3 14.84 ▼ 4.81% MBRFY 2.94 ▼ 0.34% INTER 5.29 ▼ 3.11% EGX 53,932 ▼ 0.11% USD/ZAR 16.82 ▲ 0.04% USD/NGN 1,363 ▼ 0.24% NIKKEI 64,611 ▼ 2.73% CSI300 4,649 ▼ 1.67% HSI 24,963 ▼ 0.98% NIFTY 23,767 ▼ 0.43% KOSPI 6,691 ▼ 5.72% JCI 6,196 ▼ 1.88% USD/JPY 163.79 ▲ 0.02% USD/CNY 6.7617 ▼ 0.07% DAX 25,099 ▲ 1.36% CAC 8,372 ▲ 0.88% FTSE 10,736 ▲ 0.91% MIB 51,802 ▲ 0.95% IBEX 19,585 ▲ 1.65% STOXX 644.51 ▲ 0.82% EUR/USD 1.1375 ▼ 0.06% GBP/USD 1.3319 ▲ 0.02% SPX 7,412 ▲ 0.05% DJI 51,947 ▲ 0.46% NDX 28,128 ▼ 1.15% RUT 2,930 ▼ 0.35% TSX 35,369 ▲ 0.50% VIX 18.58 ▼ 0.64% USD/CAD 1.4092 ▲ 0.09% US10Y 4.6790 ▼ 0.51%
since 2009
Saturday, July 25, 2026

Crude’s V-Shaped Recovery: How Oil Benchmarks Rebounded from Four-Year Lows

By · April 10, 2025 · 5 min read

Daily Brief

The morning intel from across Latin America. Free.

By subscribing you agree to our privacy policy. We never share your email.

As of this morning (April 10, 2025), WTI crude is trading at $61.38 per barrel, showing a slight increase of +0.080 (+0.13%), while Brent crude stands at $64.67, up +0.150 (+0.23%).

This represents a modest recovery following one of the most volatile trading weeks in recent years. Both benchmarks had plummeted to four-year lows earlier this week, with Brent dropping below $60 per barrel for the first time since February 2021.

The oil market experienced a dramatic rebound yesterday, with Brent achieving its largest single-day increase since October, before prices partially retreated overnight. This volatility reflects the market’s reaction to abrupt shifts in US tariff policy and ongoing concerns about global economic growth.

Key Market Drivers

US-China Trade Tensions

The primary driver behind recent oil price movements has been the escalating trade conflict between the United States and China. Yesterday, President Donald Trump announced a 90-day suspension of increased tariffs on numerous countries.

This announcement triggered an immediate positive market response. However, he simultaneously escalated duties on Chinese imports to 125%, maintaining significant pressure on the world’s largest oil importer.
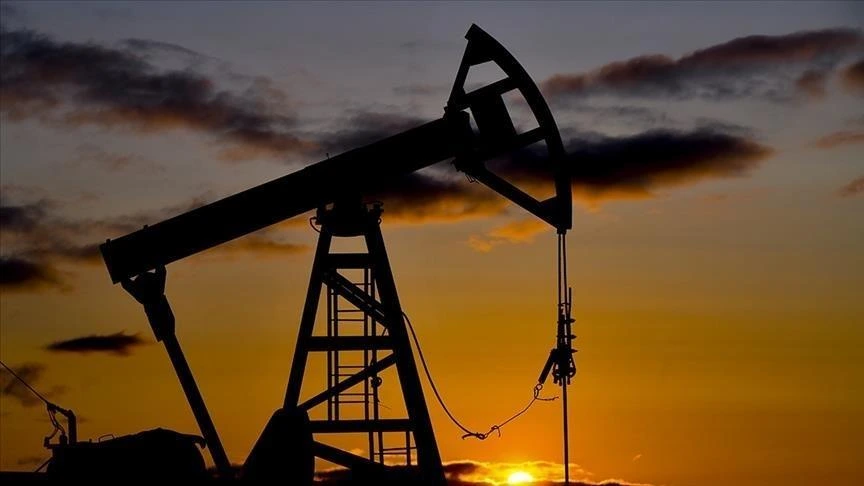
Crude's V-Shaped Recovery: How Oil Benchmarks Rebounded from Four-Year Lows
Crude’s V-Shaped Recovery: How Oil Benchmarks Rebounded from Four-Year Lows. (Photo Internet reproduction)
One-stop reference
Company Intelligence
Every listed company in Latin America — financials, ownership and structure for 1,450+ companies across 26 exchanges, in one place.
Browse the directory →

Zhou, an analyst at the Research Institute Shanghai, commented: “Given the improbable near-term resolution of the U.S.-China trade conflict, it is unlikely that this rebound will evolve into a significant trend reversal”.

The implementation of these tariffs has sparked widespread concerns about a potential global recession that could severely impact energy demand. This fear has been reflected in financial markets, with the S&P 500 experiencing one of the most dramatic reversals seen in the past fifty years on Tuesday.

OPEC+ Production Decisions

Adding to market pressures, OPEC+ recently decided to ease production restrictions more rapidly than anticipated, raising concerns about oversupply.

Specifically, the coalition plans to increase output in May by 411,000 barrels per day, a move that analysts believe could push the market into surplus.

Ashley Kelty, analyst at Panmure Liberum, noted: “Some U.S. analysts suggested that the White House wants to drive oil prices closer to $50 as the administration believes that the U.S. oil and gas industry can survive a period of disruption.

We see this goal as somewhat delusional … and it will merely see U.S. production shut in and open the door for OPEC to reclaim its position as the swing producer”.

Regional Market Analysis

North American Oil Market

WTI’s current $3.32 discount to Brent reflects ample U.S. inventories and pipeline constraints, particularly in the Permian Basin. Eagle Ford crude experienced a 9.85% decline to $57.18, underscoring the vulnerability of shale producers to price swings.

Contrary to expectations, API data showed U.S. crude inventories fell by 1.1 million barrels in the week ended April 4, compared with projections for a build of about 1.4 million barrels. This unexpected drawdown provided some support for oil prices.

Industry experts suggest that US drilling activity could slow significantly if WTI prices remain below $65 per barrel, potentially affecting future supply.

Asian and European Markets

In Asia, economic concerns continue to mount as Chinese data indicated that consumer deflation persisted for a second consecutive month in March, while factory deflation extended into its 30th month.

Chinese leaders are expected to meet today to discuss potential economic stimulus measures, particularly for struggling sectors like housing and consumer spending.

In the European natural gas market, futures prices at the Title Transfer Facility (TTF) in the Netherlands decreased 27 cents to a weekly average of $13.08/MMBtu. Meanwhile, Russia’s ESPO Blend oil price fell below the $60 per barrel Western price cap level for the first time ever on Monday.

Investment Flows and Market Sentiment

The market volatility has triggered significant movements in oil-related investment products. The ProShares UltraShort Bloomberg Crude Oil ETF experienced an outflow of $72.2 million, the largest since early 2020, indicating that some investors are taking profits as oil prices fall.

Conversely, the United States Oil Fund saw a surge of $275 million in inflows, although it subsequently faced an outflow of $98.7 million. Overall, the crude oil market recorded an $11.6 billion net inflow in the week ending April 4, highlighting renewed investor interest despite the uncertainty.

Retail investors have increasingly engaged with commodity-linked products, contributing to market liquidity but also potentially amplifying short-term volatility.

Technical Analysis and Price Outlook

From a technical perspective, WTI crude recently broke through the support area at the $60 level but has since rebounded above this threshold. The market now faces significant resistance at $65, which represents a “massive barrier” according to technical analysts.

For Brent crude, technical analysis revealed an indecision doji candle on the daily timeframe, potentially hinting at a recovery. The RSI (Relative Strength Index) had entered oversold territory, suggesting a possible momentum shift.

Key resistance levels for Brent are identified at $66.42, $68.17, and $69.52, while support exists at $62.76, $61.00, and the psychological $60.00 level.

Several segments of the oil futures market remain in contango—a bearish pricing structure where short-term contracts are priced lower than those for longer durations. This structure typically indicates expectations of oversupply.

Expert Opinions and Forecasts

Goldman Sachs has revised its oil price forecasts, projecting that Brent and WTI crude will reach $62 and $58 per barrel, respectively, by December 2025, before declining further to $55 and $51 by December 2026. These projections assume that the U.S. economy will avoid a recession and that OPEC+ will modestly increase supply.

Under a recession scenario, Goldman predicts Brent could drop to $58 by December 2025 and $50 by December 2026. In a more severe scenario involving both global economic slowdown and complete reversal of OPEC+ production cuts, they forecast Brent prices could plummet to just below $40 per barrel by late 2026.

Yeap Jun Rong, a market strategist at IG Asia Pte, remarked: “We may anticipate oil prices to revert to their broader downward trend once the current optimism surrounding the tariff reprieve diminishes. Demand-side challenges remain, with China’s growth outlook jeopardized by ongoing reciprocal measures”.

Conclusion

The oil market continues to navigate exceptional volatility driven primarily by geopolitical tensions and macroeconomic concerns. While today’s modest price recovery offers some respite, structural challenges remain.

The interplay between US-China trade relations, OPEC+ production decisions, and global economic growth will likely continue to drive price movements in the coming weeks.

Market participants should closely monitor developments in trade negotiations, upcoming inventory data, and signals from Chinese policymakers regarding potential stimulus measures, as these factors will be crucial in determining the medium-term trajectory of oil prices.

Live Market IntelligenceCommodities — Live Market BoardInside: market breadth, the sector heatmap, currencies & rates, the Latin America scoreboard and the full instrument board.

Rio Times · Live Market Intelligence

Commodities — Live Market Board

Global
Jul 25, 2026 · 13:49

Brent crude · benchmark
96.78
-3.88%
L 95.14day rangeH 101.16

+41.41% over 12 months

Market breadth · 15 names
53% advancing

8 ▲ advancing7 declining ▼

Currencies, rates & key inputs
Gold
4,071
+0.60%

Silver
58.91
+1.92%

Copper
6.36
+0.83%

Iron ore
161.91
·

WTI crude
89.31
-3.12%

Full instrument board
Instrument Last Change YoY Prev. High Low Volume
GOLD 4,071 +0.60% +22.10% 4,047 4,085 4,024 112,402
SILVER 58.91 +1.92% +54.34% 57.80 59.29 57.36 26,053
BRENT 96.78 -3.88% +41.41% 100.69 101.16 95.14 29,916
WTI 89.31 -3.12% +37.06% 92.19 92.83 87.68 336,373
COPPER 6.36 +0.83% +10.31% 6.30 6.38 6.31 28,473
LITHIUM 67.81 -1.75% +51.94% 69.02 68.69 67.73 177,410
IRON ORE 161.91 +64.29% 161.91 161.91 1
SOY 1,254 +1.29% +25.51% 1,238 1,257 1,238 166,916
CORN 487.25 +5.01% +21.96% 464.00 492.00 479.25 257,469
WHEAT 678.00 -2.62% +25.96% 696.25 711.25 659.50 117,726
COFFEE 298.25 -3.60% +0.24% 309.40 318.55 306.40 14,168
SUGAR 14.76 +0.48% -9.39% 14.69 14.79 14.54 45,966
COCOA 5,467 +3.13% -34.36% 5,301 5,438 5,227 17,604
ORANGE JUICE 142.65 -2.83% -55.75% 146.80 146.15 141.50 345
COTTON 79.89 +0.06% +19.22% 79.84 80.76 78.28 9,674
BEEF 222.50 -1.29% -1.76% 225.40 224.13 220.78 19,283
CATTLE 341.45 -0.68% +3.04% 343.77 345.48 337.25 9,940
USD/BRL 5.08 -0.24% -8.00% 5.09 5.08 5.08

Largest moves today
CORN
487.25
+5.01%
BRENT
96.78
-3.88%
COFFEE
298.25
-3.60%
COCOA
5,467
+3.13%
WTI
89.31
-3.12%
ORANGE JUICE
142.65
-2.83%
WHEAT
678.00
-2.62%
SILVER
58.91
+1.92%

The session read
The Brent crude eased 3.88%, with breadth positive — 8 of 15 names higher. CORN led, while COFFEE lagged.

LatAm Markets: Live Signals → — real-time movers, turnover leaders and FX across Latin America.

Read More from The Rio Times

The Rio Times · Power Map
See who really holds power in Latin America
Click to open the Power Map

Rotate for Best Experience

This report is optimized for landscape viewing. Rotate your phone for the full experience.