IBOV 183,476.86 ▼ 0.27% IPSA 11,255.90 ▼ 0.39% IPC MEX 64,992.23 ▲ 1.13% MERVAL 2,893,751 ▼ 1.57% COLCAP 2,584.72 ▼ 0.95% BVL PERÚ 59,934.37 ▲ 1.27% USD/BRL5.19▼ 0.12% USD/MXN17.68▼ 0.27% USD/CLP960.63▼ 0.27% USD/COP3,293▲ 0.20% USD/PEN3.39▼ 0.67% USD/ARS1,525▲ 0.30% USD/UYU40.21▲ 3.50% USD/PYG5,870▲ 2.23% USD/BOB12.17▲ 2.05% USD/DOP59.35▲ 0.25% USD/CRC450.87▲ 2.53% USD/GTQ7.64▲ 3.22% USD/HNL26.85▲ 0.31% USD/NIO36.62▲ 2.66% USD/VES853.52▼ 0.13% USD/PAB1.00— 0.00% USD/BZD2.00— 0.00% USD/JMD 157.28 — 0.00% USD/TTD6.77▲ 2.72% EUR/BRL5.91▲ 0.63% BRENT 88.88 ▼ 0.03% WTI 83.11 ▼ 0.11% IRON ORE 161.91 — — COPPER 6.61 ▲ 0.03% GOLD 4,461 ▲ 1.78% SILVER 65.59 ▲ 1.26% SOY 1,184 ▲ 3.20% CORN 480.50 ▲ 10.02% WHEAT 655.00 ▲ 3.93% COFFEE 317.25 ▼ 5.51% SUGAR 16.43 ▼ 1.79% ORANGE JUICE 138.55 ▼ 0.47% COTTON 85.03 ▲ 2.33% COCOA 5,719 ▲ 3.18% BEEF 223.60 ▼ 3.93% CATTLE 339.10 ▼ 3.16% LITHIUM 75.20 ▲ 1.47% PETR4 41.64 ▼ 0.05% VALE3 72.97 ▲ 0.83% ITUB4 38.60 ▼ 1.03% BBDC4 16.85 ▲ 0.36% ABEV3 14.89 ▼ 0.80% BBAS3 19.37 ▲ 0.47% B3SA3 14.26 ▼ 0.21% WEGE3 47.59 ▲ 0.49% PRIO3 59.14 ▼ 0.19% SUZB3 41.33 ▲ 2.35% RENT3 34.68 ▼ 0.09% AZZA3 15.89 ▼ 2.63% CSAN3 3.22 ▼ 1.83% RAIZ4 0.25 — 0.00% PCAR3 2.75 ▼ 0.36% GMAT3 3.65 ▼ 1.08% PSSA3 48.13 ▼ 0.54% CVCB3 1.33 ▼ 2.92% POSI3 3.36 ▲ 2.44% SLCE3 13.34 ▲ 0.30% NATU3 8.14 ▼ 0.73% IBOV 183,476.86 ▼ 0.27% IPSA 11,255.90 ▼ 0.39% IPC MEX 64,992.23 ▲ 1.13% MERVAL 2,893,751 ▼ 1.57% COLCAP 2,584.72 ▼ 0.95% BVL PERÚ 59,934.37 ▲ 1.27% USD/BRL 5.16 ▲ 0.01% USD/MXN 17.06 ▼ 0.24% USD/CLP 913.98 ▲ 0.04% USD/COP 3,140 ▲ 0.03% USD/PEN 3.36 ▼ 0.66% USD/ARS 1,493 ▲ 0.10% USD/UYU 40.27 ▲ 1.24% USD/PYG 5,939 ▲ 1.68% USD/BOB 11.64 ▼ 0.76% USD/DOP 58.34 ▲ 1.25% USD/CRC 445.92 ▲ 0.89% USD/GTQ 7.62 ▲ 2.21% USD/HNL 26.79 ▲ 1.57% USD/NIO 36.62 ▲ 0.69% USD/VES 762.44 ▼ 0.13% USD/PAB 1.00 — 0.00% USD/BZD 2.00 — 0.00% USD/JMD 157.28 — 0.00% USD/TTD 6.70 ▲ 0.61% EUR/BRL 5.95 ▲ 1.01% BRENT 88.88 ▼ 0.03% WTI 83.11 ▼ 0.11% IRON ORE 161.91 — — COPPER 6.61 ▲ 0.03% GOLD 4,461 ▲ 1.78% SILVER 65.59 ▲ 1.26% SOY 1,184 ▲ 3.20% CORN 480.50 ▲ 10.02% WHEAT 655.00 ▲ 3.93% COFFEE 317.25 ▼ 5.51% SUGAR 16.43 ▼ 1.79% ORANGE JUICE 138.55 ▼ 0.47% COTTON 85.03 ▲ 2.33% COCOA 5,719 ▲ 3.18% BEEF 223.60 ▼ 3.93% CATTLE 339.10 ▼ 3.16% LITHIUM 75.20 ▲ 1.47% PETR4 41.64 ▼ 0.05% VALE3 72.97 ▲ 0.83% ITUB4 38.60 ▼ 1.03% BBDC4 16.85 ▲ 0.36% ABEV3 14.89 ▼ 0.80% BBAS3 19.37 ▲ 0.47% B3SA3 14.26 ▼ 0.21% WEGE3 47.59 ▲ 0.49% PRIO3 59.14 ▼ 0.19% SUZB3 41.33 ▲ 2.35% RENT3 34.68 ▼ 0.09% AZZA3 15.89 ▼ 2.63% CSAN3 3.22 ▼ 1.83% RAIZ4 0.25 — 0.00% PCAR3 2.75 ▼ 0.36% GMAT3 3.65 ▼ 1.08% PSSA3 48.13 ▼ 0.54% CVCB3 1.33 ▼ 2.92% POSI3 3.36 ▲ 2.44% SLCE3 13.34 ▲ 0.30% NATU3 8.14 ▼ 0.73%
since 2009
Saturday, September 26, 2026

World-News China

China’s Q1 Economic Growth Fuels Debate Over Data Accuracy Amid Trade Tensions

By · April 16, 2025 · 2 min read

The LatAm Brief

One email, every weekday morning. What moved in Latin American markets, politics and expat life.

Yesterday’s subject line: “The US Army is quietly planning for Cuba”

Free. We send a confirmation link first — nothing arrives until you click it. Unsubscribe with one click in any edition. If you stop opening us for 30 days we stop sending by ourselves, as we assume the interest is no longer there. See our privacy policy. We never share your email.

China’s National Bureau of Statistics reported 5.4% GDP growth for Q1 2025, exceeding its annual target through industrial expansion and retail resilience.

The $4.35 trillion output followed 6.5% industrial production growth and a 45.4% surge in electric vehicle manufacturing. Retail sales climbed 4.6%, with e-commerce capturing 24% of consumer spending. Export growth reached 6.9% despite escalating U.S. tariffs.

Analysts question the official figures given historical discrepancies in Chinese economic reporting. Independent researchers estimate actual 2024 growth at 2.4-2.8% versus Beijing’s 5.2% claim.

Local governments have previously inflated statistics, including Liaoning province’s 127% overstatement of fiscal revenues. The rapid 12-day data release window and exclusion of metrics like industrial capacity utilization (74.1% in Q1) deepen skepticism.

The reported growth preceded full implementation of U.S. tariffs hitting 145% on Chinese electric vehicles, semiconductors, and solar panels.
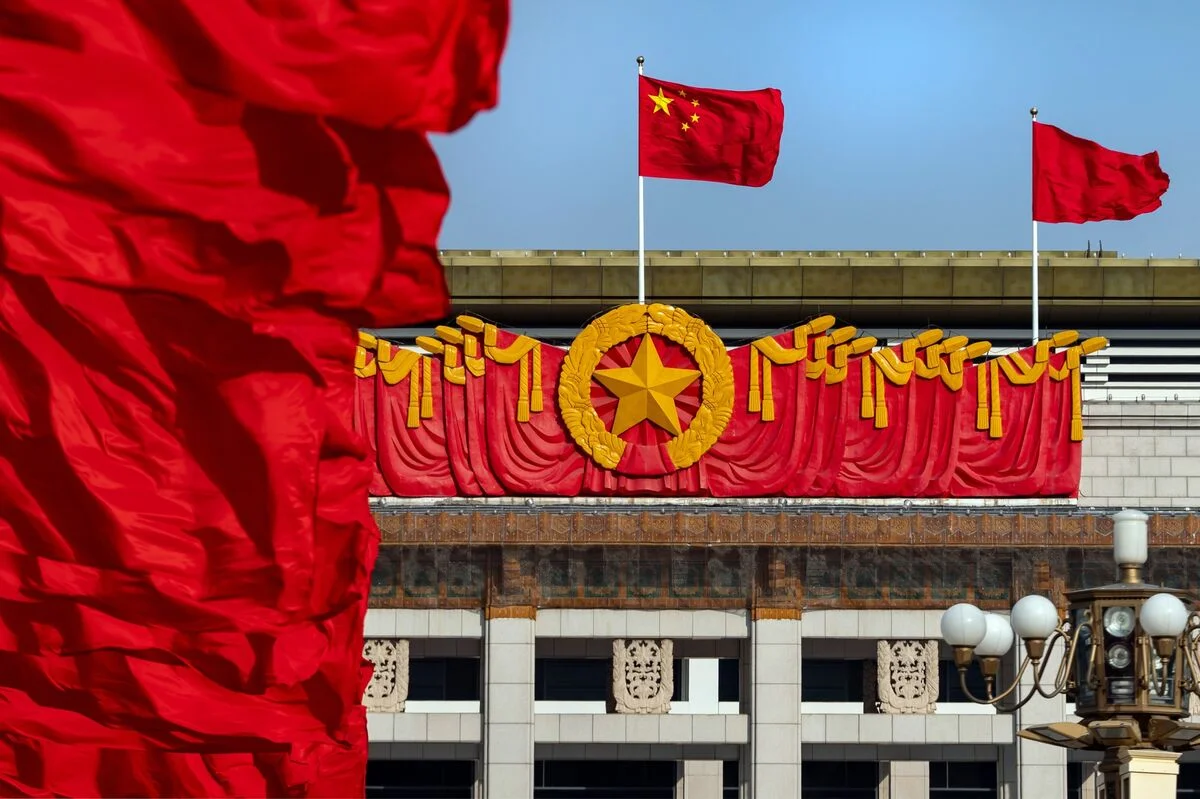
China's Q1 Economic Growth Fuels Debate Over Data Accuracy Amid Trade Tensions
China’s Q1 Economic Growth Fuels Debate Over Data Accuracy Amid Trade Tensions.
One-stop reference
Company Intelligence
Every listed company in Latin America — financials, ownership and structure for 1,450+ companies across 26 exchanges, in one place.
Browse the directory →
RT
Ask Rio Times
17 years of Latin America reporting, on demand.
Open the full Ask Rio Times →

Retaliatory 125% Chinese duties on American farm goods contributed to a 6% import contraction. Private firms now drive 56.8% of foreign trade, reflecting state-owned enterprises’ declining dominance.

Structural vulnerabilities persist beneath headline numbers. Unsold housing inventory exceeds two years of demand while consumer prices dipped 0.1% despite monetary stimulus.

China’s Fragile Recovery

Urban unemployment held at 5.2%, with youth joblessness data remaining unpublished. Thirty-five provincial governments face technical insolvency amid $13 trillion local debt burdens.

Manufacturing expanded 7.1%, powered by robotics and semiconductor investments. High-tech sectors attracted 30.3% more capital, particularly in aerospace and AI infrastructure.

Agricultural output grew 4% through grain security initiatives, while IT services advanced 10.3%. Railway freight volumes and electricity consumption rose 3.8% and 4.2% respectively, trailing official industrial growth claims.

The People’s Bank injected $140 billion in liquidity this year, cutting reserve ratios twice to spur lending. Household savings rates remain elevated at 36%, constraining domestic consumption.

UBS revised its 2025 growth forecast to 3.4%, citing tariff impacts and property sector risks still accounting for 25% of economic activity. Export-reliant industries face mounting pressure as U.S. measures take effect.

March’s 6.1% industrial output growth contrasts with a 7.7% production increase, suggesting inventory buildup ahead of trade disruptions.

International analysts project Q2 expansion between 3.8-4.6%, testing Beijing’s capacity to balance strategic industries against global market realities.

This article was produced by The Rio Times’ automated newsroom system. How we use AI · Report an error

Read More from The Rio Times

The Rio Times · Power Map
See who really holds power in Latin America
Click to open the Power Map →

Rotate for Best Experience

This report is optimized for landscape viewing. Rotate your phone for the full experience.