IBOV 187,422.92 ▲ 0.44% IPSA 11,426.83 ▲ 0.61% IPC MEX 64,456.59 ▲ 1.45% MERVAL 2,997,659 ▼ 0.04% COLCAP 2,588.64 ▲ 0.90% BVL PERÚ 59,529.36 ▲ 1.84% USD/BRL5.11▲ 0.10% USD/MXN17.33▲ 0.21% USD/CLP943.65▼ 0.59% USD/COP3,204— 0.00% USD/PEN3.38▲ 0.09% USD/ARS1,514▼ 0.02% USD/UYU40.06▲ 2.88% USD/PYG5,918▲ 3.14% USD/BOB11.85▲ 25.24% USD/DOP59.28▲ 0.82% USD/CRC445.27▲ 2.84% USD/GTQ7.63▲ 3.24% USD/HNL26.86▲ 3.32% USD/NIO36.62▲ 2.68% USD/VES851.37— 0.00% USD/PAB1.00— 0.00% USD/BZD2.00— 0.00% USD/JMD 157.28 — 0.00% USD/TTD6.74▲ 2.48% EUR/BRL5.83▼ 0.38% BRENT 88.88 ▼ 0.03% WTI 83.11 ▼ 0.11% IRON ORE 161.91 — — COPPER 6.61 ▲ 0.03% GOLD 4,461 ▲ 1.78% SILVER 65.59 ▲ 1.26% SOY 1,184 ▲ 3.20% CORN 480.50 ▲ 10.02% WHEAT 655.00 ▲ 3.93% COFFEE 317.25 ▼ 5.51% SUGAR 16.43 ▼ 1.79% ORANGE JUICE 138.55 ▼ 0.47% COTTON 85.03 ▲ 2.33% COCOA 5,719 ▲ 3.18% BEEF 223.60 ▼ 3.93% CATTLE 339.10 ▼ 3.16% LITHIUM 75.20 ▲ 1.47% PETR4 41.64 ▼ 0.05% VALE3 72.97 ▲ 0.83% ITUB4 38.60 ▼ 1.03% BBDC4 16.85 ▲ 0.36% ABEV3 14.89 ▼ 0.80% BBAS3 19.37 ▲ 0.47% B3SA3 14.26 ▼ 0.21% WEGE3 47.59 ▲ 0.49% PRIO3 59.14 ▼ 0.19% SUZB3 41.33 ▲ 2.35% RENT3 34.68 ▼ 0.09% AZZA3 15.89 ▼ 2.63% CSAN3 3.22 ▼ 1.83% RAIZ4 0.25 — 0.00% PCAR3 2.75 ▼ 0.36% GMAT3 3.65 ▼ 1.08% PSSA3 48.13 ▼ 0.54% CVCB3 1.33 ▼ 2.92% POSI3 3.36 ▲ 2.44% SLCE3 13.34 ▲ 0.30% NATU3 8.14 ▼ 0.73% IBOV 187,422.92 ▲ 0.44% IPSA 11,426.83 ▲ 0.61% IPC MEX 64,456.59 ▲ 1.45% MERVAL 2,997,659 ▼ 0.04% COLCAP 2,588.64 ▲ 0.90% BVL PERÚ 59,529.36 ▲ 1.84% USD/BRL 5.16 ▲ 0.01% USD/MXN 17.06 ▼ 0.24% USD/CLP 913.98 ▲ 0.04% USD/COP 3,140 ▲ 0.03% USD/PEN 3.36 ▼ 0.66% USD/ARS 1,493 ▲ 0.10% USD/UYU 40.27 ▲ 1.24% USD/PYG 5,939 ▲ 1.68% USD/BOB 11.64 ▼ 0.76% USD/DOP 58.34 ▲ 1.25% USD/CRC 445.92 ▲ 0.89% USD/GTQ 7.62 ▲ 2.21% USD/HNL 26.79 ▲ 1.57% USD/NIO 36.62 ▲ 0.69% USD/VES 762.44 ▼ 0.13% USD/PAB 1.00 — 0.00% USD/BZD 2.00 — 0.00% USD/JMD 157.28 — 0.00% USD/TTD 6.70 ▲ 0.61% EUR/BRL 5.95 ▲ 1.01% BRENT 88.88 ▼ 0.03% WTI 83.11 ▼ 0.11% IRON ORE 161.91 — — COPPER 6.61 ▲ 0.03% GOLD 4,461 ▲ 1.78% SILVER 65.59 ▲ 1.26% SOY 1,184 ▲ 3.20% CORN 480.50 ▲ 10.02% WHEAT 655.00 ▲ 3.93% COFFEE 317.25 ▼ 5.51% SUGAR 16.43 ▼ 1.79% ORANGE JUICE 138.55 ▼ 0.47% COTTON 85.03 ▲ 2.33% COCOA 5,719 ▲ 3.18% BEEF 223.60 ▼ 3.93% CATTLE 339.10 ▼ 3.16% LITHIUM 75.20 ▲ 1.47% PETR4 41.64 ▼ 0.05% VALE3 72.97 ▲ 0.83% ITUB4 38.60 ▼ 1.03% BBDC4 16.85 ▲ 0.36% ABEV3 14.89 ▼ 0.80% BBAS3 19.37 ▲ 0.47% B3SA3 14.26 ▼ 0.21% WEGE3 47.59 ▲ 0.49% PRIO3 59.14 ▼ 0.19% SUZB3 41.33 ▲ 2.35% RENT3 34.68 ▼ 0.09% AZZA3 15.89 ▼ 2.63% CSAN3 3.22 ▼ 1.83% RAIZ4 0.25 — 0.00% PCAR3 2.75 ▼ 0.36% GMAT3 3.65 ▼ 1.08% PSSA3 48.13 ▼ 0.54% CVCB3 1.33 ▼ 2.92% POSI3 3.36 ▲ 2.44% SLCE3 13.34 ▲ 0.30% NATU3 8.14 ▼ 0.73%
since 2009
Wednesday, September 23, 2026

China Overtakes the U.S. as Mexico’s Top Auto Supplier

By · July 26, 2024 · 2 min read

The LatAm Brief

One email, every weekday morning. What moved in Latin American markets, politics and expat life.

Yesterday’s subject line: “68 strikes, 223 people. A UN expert says murder.”

Free. We send a confirmation link first — nothing arrives until you click it. Unsubscribe with one click in any edition. If you stop opening us for 30 days we stop sending by ourselves, as we assume the interest is no longer there. See our privacy policy. We never share your email.

In a significant shift in global automotive trade dynamics, China has surpassed the United States as the primary source of automobile imports into Mexico.

According to data released by the Mexican Ministry of Economy, in 2023, Mexico purchased automobiles worth $4.602 billion from China.

In addition, this amount edged out the $4.486 billion sourced from the United States.

This development underscores China’s robust manufacturing capabilities, as it remains the world’s largest producer of light vehicles.

China’s aggressive sales strategy on the global stage has paid dividends, especially in its dealings with Mexico.
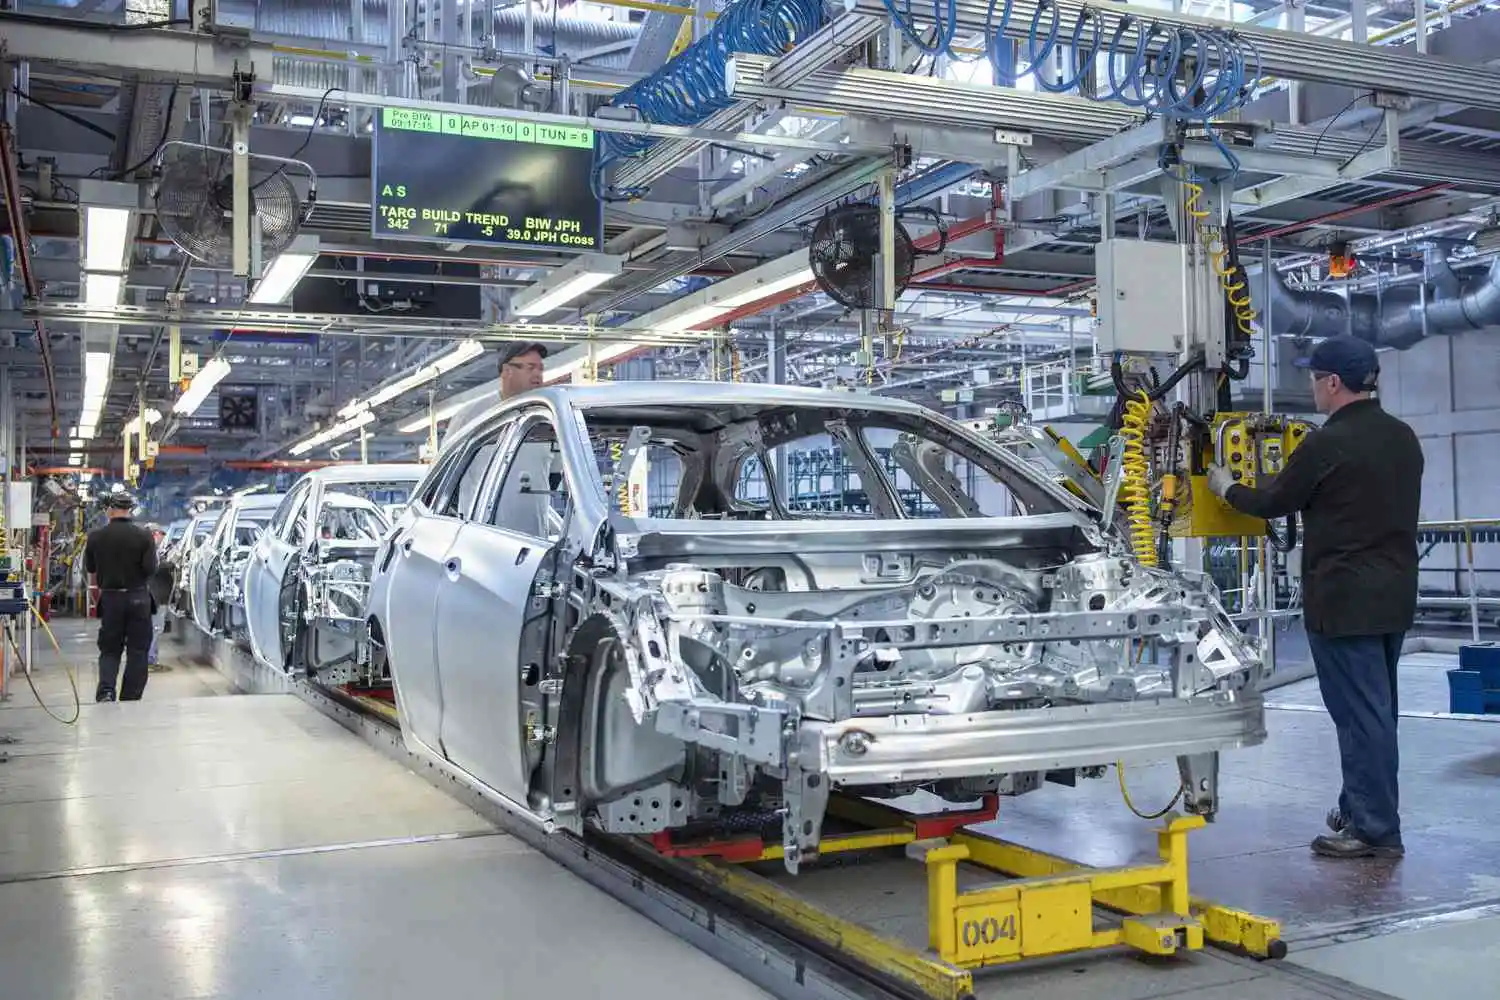
China Overtakes the U.S. as Mexico's Top Auto Supplier
China Overtakes the U.S. as Mexico’s Top Auto Supplier.
One-stop reference
Company Intelligence
Every listed company in Latin America — financials, ownership and structure for 1,450+ companies across 26 exchanges, in one place.
Browse the directory →
RT
Ask Rio Times
17 years of Latin America reporting, on demand.
Open the full Ask Rio Times →

The volume of Chinese car imports to Mexico doubled in 2023, marking a 100% increase, while imports from the U.S. grew by 39.6%.

Looking back over the past decade, the rise of Chinese imports is even more striking.

In 2014, Mexican imports from China were negligible compared to the $3.285 billion in automobiles imported from the U.S.

This trend continued into the first five months of 2024. During this period, Chinese imports into Mexico grew by 50.8%, while U.S. imports declined by 13.9%.

The growth extends beyond conventional vehicles, with China emerging as a powerhouse in the electric vehicle (EV) sector.

Impacts on Global Markets

European markets have seen a significant rise in Chinese-made EVs, prompting the European Commission to investigate China’s pricing strategies, influenced by substantial state subsidies.

This investigation, initiated on October 4, 2023, focuses on whether these subsidies distort the EU market. China’s automotive prowess is further highlighted by its internal market growth.

According to the China Association of Automobile Manufacturers (CAAM), the production and sales volume of passenger cars in China reached 26.1 million units in 2023.

This marked a 10.6% increase from the previous year. Meanwhile, the production and sales of commercial vehicles in the same year saw rises of 25.0% and 21.2%, respectively.

This surge is not limited to the domestic front. Chinese car exports surged dramatically, with a 146% increase in 2021, an 83% rise in 2022, and a 74% jump in 2023.

Such growth rates enabled China to surpass the U.S. in global auto exports in 2023, totaling $77.659 billion compared to the U.S.’s $63.035 billion.

China’s ascendancy in the automotive sector is not merely a tale of increasing numbers. It is a reflection of strategic market penetration and technological advancements.

This shift from a minor player to a dominant force highlights major changes in the global economic and industrial landscapes. It highlights the ever-changing dynamics of international trade.

This article was produced by The Rio Times’ automated newsroom system. How we use AI · Report an error

Read More from The Rio Times

The Rio Times · Power Map
See who really holds power in Latin America
Click to open the Power Map

Rotate for Best Experience

This report is optimized for landscape viewing. Rotate your phone for the full experience.