IBOV 175,664.62 ▲ 0.30% IPSA 11,445.90 ▼ 0.22% IPC MEX 65,561.46 ▼ 0.41% MERVAL 2,979,472 ▼ 0.72% COLCAP 2,457.87 ▼ 1.28% BVL PERÚ 60,779.49 ▼ 1.40% USD/BRL5.19▲ 0.45% USD/MXN17.03▲ 0.26% USD/CLP930.58▲ 0.45% USD/COP3,202▲ 2.39% USD/PEN3.35▼ 0.07% USD/ARS1,512— 0.00% USD/UYU40.27▲ 1.50% USD/PYG5,900▲ 0.50% USD/BOB11.78▲ 3.59% USD/DOP58.61▲ 0.96% USD/CRC446.65▲ 0.98% USD/GTQ7.62▲ 2.25% USD/HNL26.84▲ 0.40% USD/NIO36.62▼ 0.02% USD/VES789.69▼ 0.13% USD/PAB1.00— 0.00% USD/BZD2.00— 0.00% USD/JMD 157.28 — 0.00% USD/TTD6.72▲ 0.77% EUR/BRL6.01▲ 0.17% BRENT 88.88 ▼ 0.03% WTI 83.11 ▼ 0.11% IRON ORE 161.91 — — COPPER 6.61 ▲ 0.03% GOLD 4,461 ▲ 1.78% SILVER 65.59 ▲ 1.26% SOY 1,184 ▲ 3.20% CORN 480.50 ▲ 10.02% WHEAT 655.00 ▲ 3.93% COFFEE 317.25 ▼ 5.51% SUGAR 16.43 ▼ 1.79% ORANGE JUICE 138.55 ▼ 0.47% COTTON 85.03 ▲ 2.33% COCOA 5,719 ▲ 3.18% BEEF 223.60 ▼ 3.93% CATTLE 339.10 ▼ 3.16% LITHIUM 75.20 ▲ 1.47% PETR4 41.64 ▼ 0.05% VALE3 72.97 ▲ 0.83% ITUB4 38.60 ▼ 1.03% BBDC4 16.85 ▲ 0.36% ABEV3 14.89 ▼ 0.80% BBAS3 19.37 ▲ 0.47% B3SA3 14.26 ▼ 0.21% WEGE3 47.59 ▲ 0.49% PRIO3 59.14 ▼ 0.19% SUZB3 41.33 ▲ 2.35% RENT3 34.68 ▼ 0.09% AZZA3 15.89 ▼ 2.63% CSAN3 3.22 ▼ 1.83% RAIZ4 0.25 — 0.00% PCAR3 2.75 ▼ 0.36% GMAT3 3.65 ▼ 1.08% PSSA3 48.13 ▼ 0.54% CVCB3 1.33 ▼ 2.92% POSI3 3.36 ▲ 2.44% SLCE3 13.34 ▲ 0.30% NATU3 8.14 ▼ 0.73% IBOV 175,664.62 ▲ 0.30% IPSA 11,445.90 ▼ 0.22% IPC MEX 65,561.46 ▼ 0.41% MERVAL 2,979,472 ▼ 0.72% COLCAP 2,457.87 ▼ 1.28% BVL PERÚ 60,779.49 ▼ 1.40% USD/BRL 5.16 ▲ 0.01% USD/MXN 17.06 ▼ 0.24% USD/CLP 913.98 ▲ 0.04% USD/COP 3,140 ▲ 0.03% USD/PEN 3.36 ▼ 0.66% USD/ARS 1,493 ▲ 0.10% USD/UYU 40.27 ▲ 1.24% USD/PYG 5,939 ▲ 1.68% USD/BOB 11.64 ▼ 0.76% USD/DOP 58.34 ▲ 1.25% USD/CRC 445.92 ▲ 0.89% USD/GTQ 7.62 ▲ 2.21% USD/HNL 26.79 ▲ 1.57% USD/NIO 36.62 ▲ 0.69% USD/VES 762.44 ▼ 0.13% USD/PAB 1.00 — 0.00% USD/BZD 2.00 — 0.00% USD/JMD 157.28 — 0.00% USD/TTD 6.70 ▲ 0.61% EUR/BRL 5.95 ▲ 1.01% BRENT 88.88 ▼ 0.03% WTI 83.11 ▼ 0.11% IRON ORE 161.91 — — COPPER 6.61 ▲ 0.03% GOLD 4,461 ▲ 1.78% SILVER 65.59 ▲ 1.26% SOY 1,184 ▲ 3.20% CORN 480.50 ▲ 10.02% WHEAT 655.00 ▲ 3.93% COFFEE 317.25 ▼ 5.51% SUGAR 16.43 ▼ 1.79% ORANGE JUICE 138.55 ▼ 0.47% COTTON 85.03 ▲ 2.33% COCOA 5,719 ▲ 3.18% BEEF 223.60 ▼ 3.93% CATTLE 339.10 ▼ 3.16% LITHIUM 75.20 ▲ 1.47% PETR4 41.64 ▼ 0.05% VALE3 72.97 ▲ 0.83% ITUB4 38.60 ▼ 1.03% BBDC4 16.85 ▲ 0.36% ABEV3 14.89 ▼ 0.80% BBAS3 19.37 ▲ 0.47% B3SA3 14.26 ▼ 0.21% WEGE3 47.59 ▲ 0.49% PRIO3 59.14 ▼ 0.19% SUZB3 41.33 ▲ 2.35% RENT3 34.68 ▼ 0.09% AZZA3 15.89 ▼ 2.63% CSAN3 3.22 ▼ 1.83% RAIZ4 0.25 — 0.00% PCAR3 2.75 ▼ 0.36% GMAT3 3.65 ▼ 1.08% PSSA3 48.13 ▼ 0.54% CVCB3 1.33 ▼ 2.92% POSI3 3.36 ▲ 2.44% SLCE3 13.34 ▲ 0.30% NATU3 8.14 ▼ 0.73%
since 2009
Saturday, August 29, 2026

Brazil Business - Brazil

Brazil’s Trade Balance Navigates Choppy Waters in October 2024

By · October 29, 2024 · 2 min read

Daily Brief

The morning intel from across Latin America. Free.

By subscribing you agree to our privacy policy. We never share your email.

Brazil’s trade landscape revealed a mixed picture in October 2024. The country achieved a trade surplus of R$ 3.86 billion ($689 million) in the fourth week alone.

This contributed to a monthly surplus of R$ 21.55 billion ($3.85 billion). The year-to-date surplus reached an impressive R$ 352.62 billion ($62.97 billion).

Exports for the fourth week totaled R$ 34.34 billion ($6.13 billion). Imports stood at R$ 30.49 billion ($5.45 billion).

These figures paint a complex picture of Brazil’s economic interactions. The country’s ability to maintain a surplus speaks to its resilience in global markets.

However, not all sectors performed equally well. Agricultural exports saw a significant drop of 18.6%. This decline raises questions about the sector’s competitiveness.
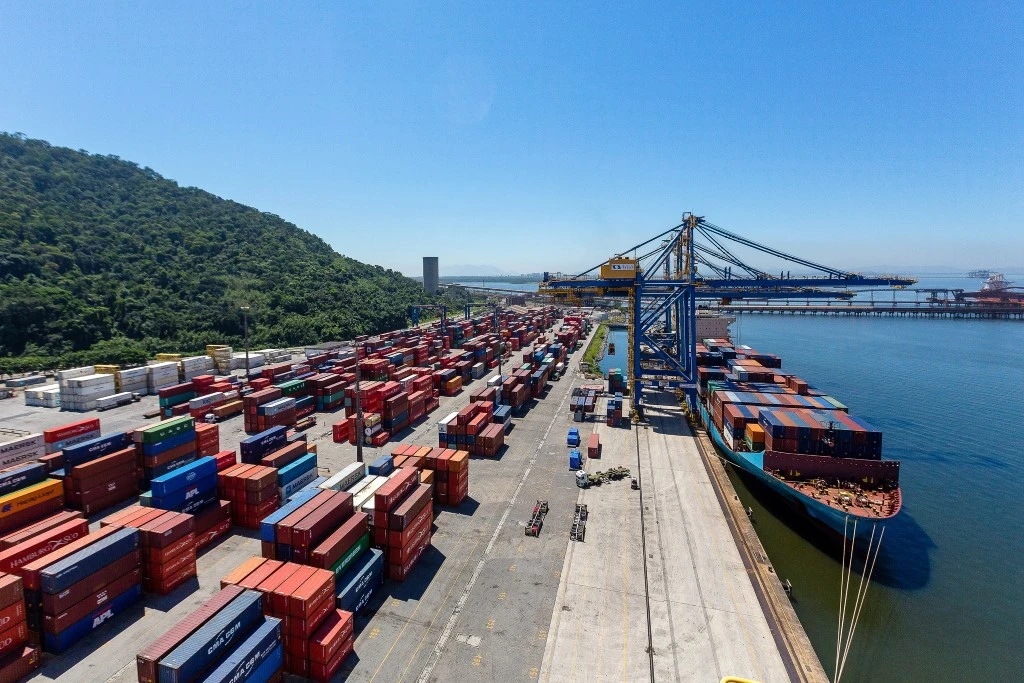
Brazil's Trade Balance Navigates Choppy Waters in October 2024
Brazil’s Trade Balance Navigates Choppy Waters in October 2024. (Photo Internet reproduction)
One-stop reference
Company Intelligence
Every listed company in Latin America — financials, ownership and structure for 1,450+ companies across 26 exchanges, in one place.
Browse the directory →
RT
Ask Rio Times
Latin American markets, currencies and companies.
Open the full Ask Rio Times →

The extractive industry also faced challenges, with exports falling by 17.6%. These decreases highlight the volatility of commodity-based exports.

Brazil’s Trade Dynamics

On a brighter note, the manufacturing industry showed signs of growth. Exports in this sector increased by 3.7%. This uptick suggests potential for diversification in Brazil’s export portfolio.

It also indicates a possible shift towards higher value-added products. Import figures tell their own story. Agricultural imports rose by 23.8%.

This increase might reflect efforts to supplement domestic production. The manufacturing sector saw a 16.7% rise in imports. This could signal increased domestic demand or industrial activity.

Compared to October 2023, daily export averages fell by 6.7%. This decline warrants attention from policymakers and businesses alike. It may indicate changing global demand or increased competition in key markets.

Import averages, conversely, grew by 14.4% year-on-year. This growth could be seen as a double-edged sword. It might indicate increased domestic consumption or investment. However, it also impacts the trade balance.

These figures emerge against a backdrop of global economic uncertainty. Brazil’s ability to maintain a trade surplus is noteworthy. It suggests a degree of economic resilience.

However, the mixed sectoral performance highlights the need for strategic planning. The trade data offers insights into Brazil‘s economic health. It reflects the country’s position in global markets.

The figures also hint at domestic economic trends. Policymakers and businesses must navigate these complex indicators carefully. As Brazil moves forward, it faces both challenges and opportunities.

The country’s trade performance will play a crucial role in shaping its economic future. Balancing sectoral needs, fostering competitiveness, and adapting to global trends will be key priorities.

This article was produced by The Rio Times’ automated newsroom system. How we use AI · Report an error

LatAm Markets: Live Signals → — real-time movers, turnover leaders and FX across Latin America.

Read More from The Rio Times

The Rio Times · Power Map
See who really holds power in Latin America
Click to open the Power Map

Rotate for Best Experience

This report is optimized for landscape viewing. Rotate your phone for the full experience.