Brazil’s Agro-Industry Was Already Shrinking Before the Iran War Made Everything Worse
Key Facts
— — Brazil’s agro-industrial output fell 1.9% in February year-over-year according to the FGV Agro PIMAgro index — critically, this data captures the period before the Iran war began on February 28, meaning the full impact of Hormuz disruptions is not yet reflected
— — The non-food agro-industrial segment collapsed 5.5%, driven by an 11.5% plunge in input manufacturing — specifically fertilizer intermediates, pesticides, tractors, and agricultural machinery — while the textile segment fell 11.1%
— — The only bright spot was biofuels, which surged 33.5%, and food-and-beverage production, which rose 0.9% — but FGV Agro warned that further contractions are expected as the Iran war’s impact on input costs cascades through the supply chain
— Deep Dive
— For the complete picture, see our guide: Iran War and Hormuz Crisis 2026.
The Rio Times, the Latin American financial news outlet, reports that the latest Brazil agro-industry data contains a warning that the headline number alone does not convey: the 1.9% contraction measured in February reflects a pre-war baseline. The Iran conflict began on February 28 — the last day of the measurement period — meaning the March and April data, when released, will capture the full Hormuz disruption that has sent fertilizer prices surging, input supply chains into crisis, and the Agriculture Ministry to issue “extremely high risk” assessments for the 2026/27 harvest.
FGV Agro’s PIMAgro index showed the contraction ended two consecutive months of growth. The January-February accumulated result stands at -0.7% — but the agro-industrial sector still outperformed Brazil’s broader manufacturing industry, which fell 2.2% in the same period.
The Fertilizer Collapse in Brazil Agro-Industry
The non-food segment tells the alarming story. An 11.5% plunge in input manufacturing — driven by reduced production of fertilizer intermediates, pesticides, tractors, and agricultural machinery — dragged the entire non-food agro-industrial group down 5.5%. This decline predates the Hormuz closure and reflects structural weaknesses in Brazil’s domestic input supply chain that the war has now dramatically amplified.
Brazil imports approximately 85% of its fertilizer consumption — over 43 million tonnes annually against roughly 7 million produced domestically. The fertilizer crisis triggered by the Iran war and Chinese export restrictions has pushed MAP (monoammonium phosphate) prices at Brazilian ports to $720 per tonne, up 13% since January. The Agriculture Ministry estimates a potential deficit of 1 to 3 million tonnes of phosphate fertilizers — enough to compromise productivity on up to 20% of national demand.
Biofuels Surge as Textiles Collapse
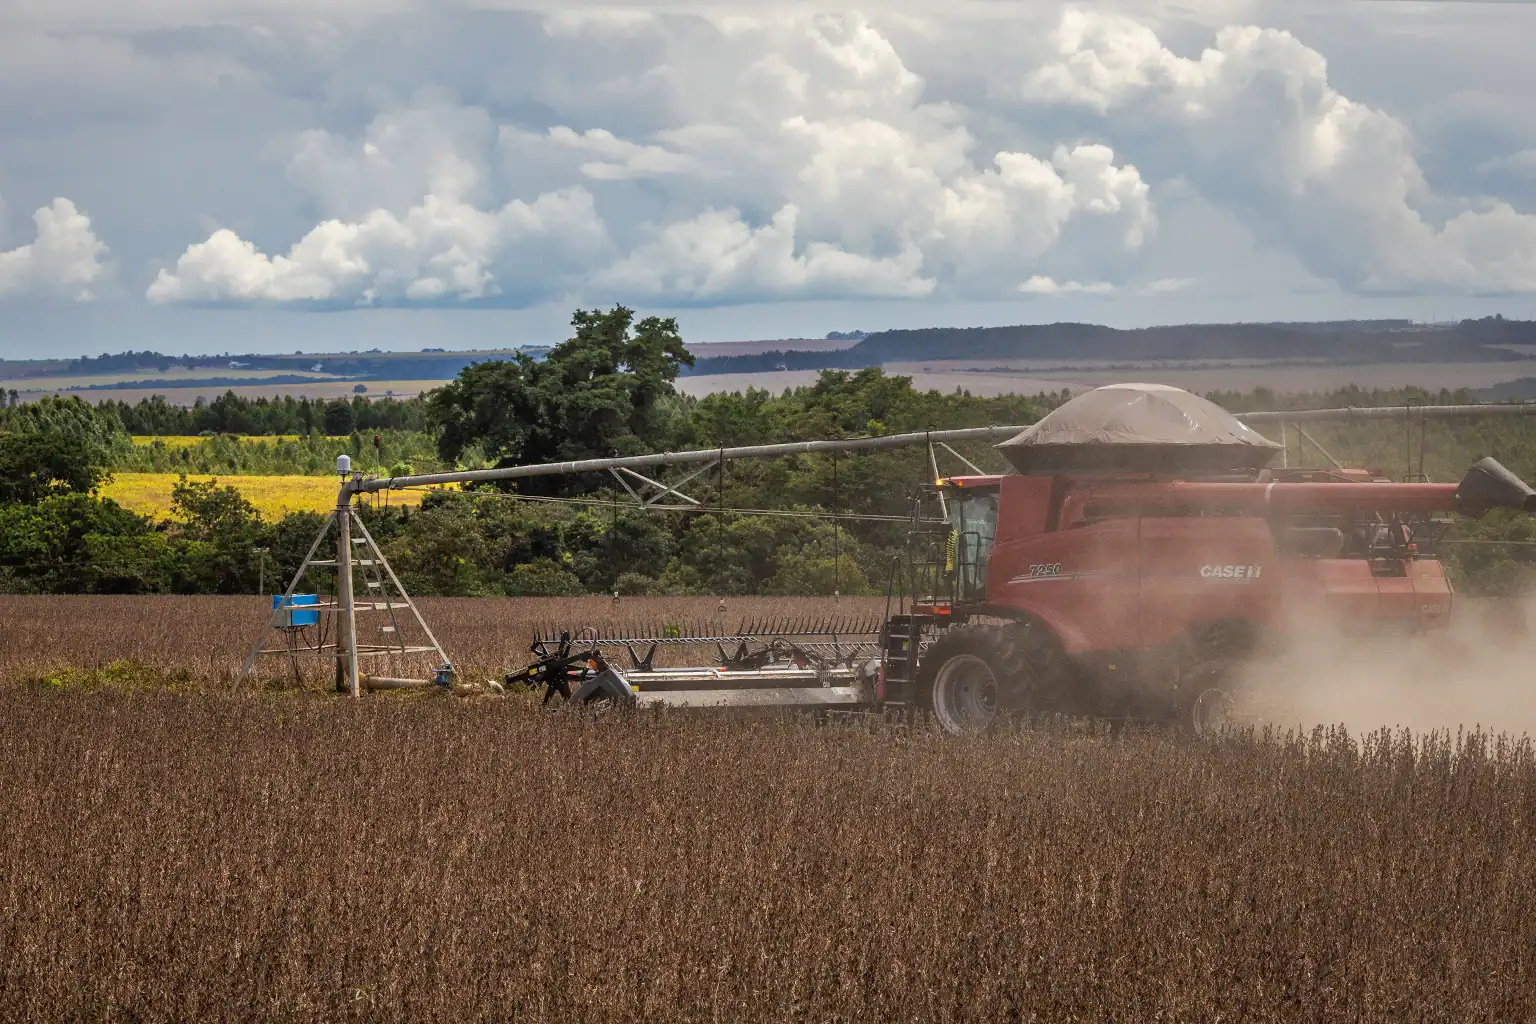
The sectoral divergence within agro-industry is stark. Biofuel production surged 33.5% — consistent with Lula’s Hannover Messe pitch that Brazil is the world’s leading biofuel producer, with 30% ethanol blend in gasoline and 15% biodiesel. The food-and-beverage segment rose 0.9%, driven by an 8.9% jump in alcoholic beverage production and 3.3% in non-alcoholic beverages, while plant-based food processing (conserves, juices, oils, sugar refining) grew 2.7%.
On the negative side, textile production plunged 11.1% due to reduced output of fibers, fabrics, clothing, footwear, and leather. Animal-origin food processing fell 1.6%, driven by declines in beef and fish production. The divergence between booming biofuels and collapsing textiles reflects two different exposure profiles to global commodity markets — one benefits from high energy prices, the other suffers from weakened consumer demand.
What Comes Next Is Worse
FGV Agro was explicit: it expects further contractions in coming months as the Iran war’s effects cascade through input costs. Brazilian farmers begin purchasing fertilizer for the September-onward 2026/27 soybean and corn planting season during the coming weeks, and Rabobank has warned that if the Hormuz disruption extends through the May-June shipping window, the squeeze will be severe. Fertilizer already accounts for 30-40% of a Brazilian farmer’s operating costs.
Petrobras is restarting domestic fertilizer plants in Bahia and Sergipe, but even at full capacity the FAFEN complex and the under-construction UFN-III plant in Mato Grosso do Sul would cover only about 35% of national nitrogen demand. The February PIMAgro data is a snapshot of an agro-industry weakening before the shock arrived — the picture when March and April numbers arrive will be considerably darker.
More: Brazil news in English, every day from The Rio Times.
This article was produced by The Rio Times’ automated newsroom system. How we use AI · Report an error
Read More from The Rio Times