Gold and Silver Prices Dip as Mexico Leads Silver Output
Key Facts
- Gold closed at 4,118 dollars per ounce falling 0.31% day-on-day in the latest settled session according to the EODHD data that powers The Rio Times price board
- Silver finished at 59.53 dollars per ounce slipping 0.43% day-on-day on the same EODHD close feed used by the board
- Gold is consolidating in a 3,900–4,300 dollars trading band after retreating from a late-January record near 5,000 dollars per ounce and a June trough just below 4,000 dollars
- Silver remains more than 50% below its January 29 peak of 121.62 dollars even after rebounding back toward the 60 dollars area following its June slide below that threshold
- Mexico remains the world’s leading silver producer with 6,300 metric tons of mine output in 2024, nearly double second-place China and ahead of third-ranked Peru at 3,100 metric tons
- Global silver mine production rose 0.9% in 2024 to 819.7 million ounces supported by recovering Mexican output and growth from Bolivia and the United States, even as Chilean production fell
Today’s Focus
Gold and silver both eased in the latest settled session, with gold at 4,118 dollars per ounce, down 0.31%, and silver at 59.53 dollars, off 0.43%, on the EODHD prices behind The Rio Times board. A firmer US dollar, higher nominal and inflation-adjusted bond yields and a preference for cash over bullion as a safe haven kept a lid on demand.
For foreign readers, the move fits into a broader mid-year correction: gold has slipped back into a 3,900–4,300 dollars range after peaking near 5,000 dollars in January, while silver has more than halved from its January 29 all-time high of 121.62 dollars to trade back around the 60 dollars mark. This leaves precious metals still well above their levels a year ago but with momentum clearly softer than in the first quarter.
The Latin American angle is central for silver: Mexico is again the world’s largest producer and Peru ranks third, so price swings at these levels feed directly into mining revenues, investment plans and export receipts across the region. For investors looking at Latin America from abroad, this backdrop matters because balance sheets and policy choices in key mining economies are intertwined with the same global forces now restraining bullion prices: the dollar, US rates and geopolitical risk.
What matters today. What matters now is whether the combination of a still-firm dollar and higher real yields continues to divert safe-haven flows away from bullion, or whether another bout of global stress forces gold and silver to reassert their traditional role, with Mexico and Peru’s mining sectors as the bellwether to watch.
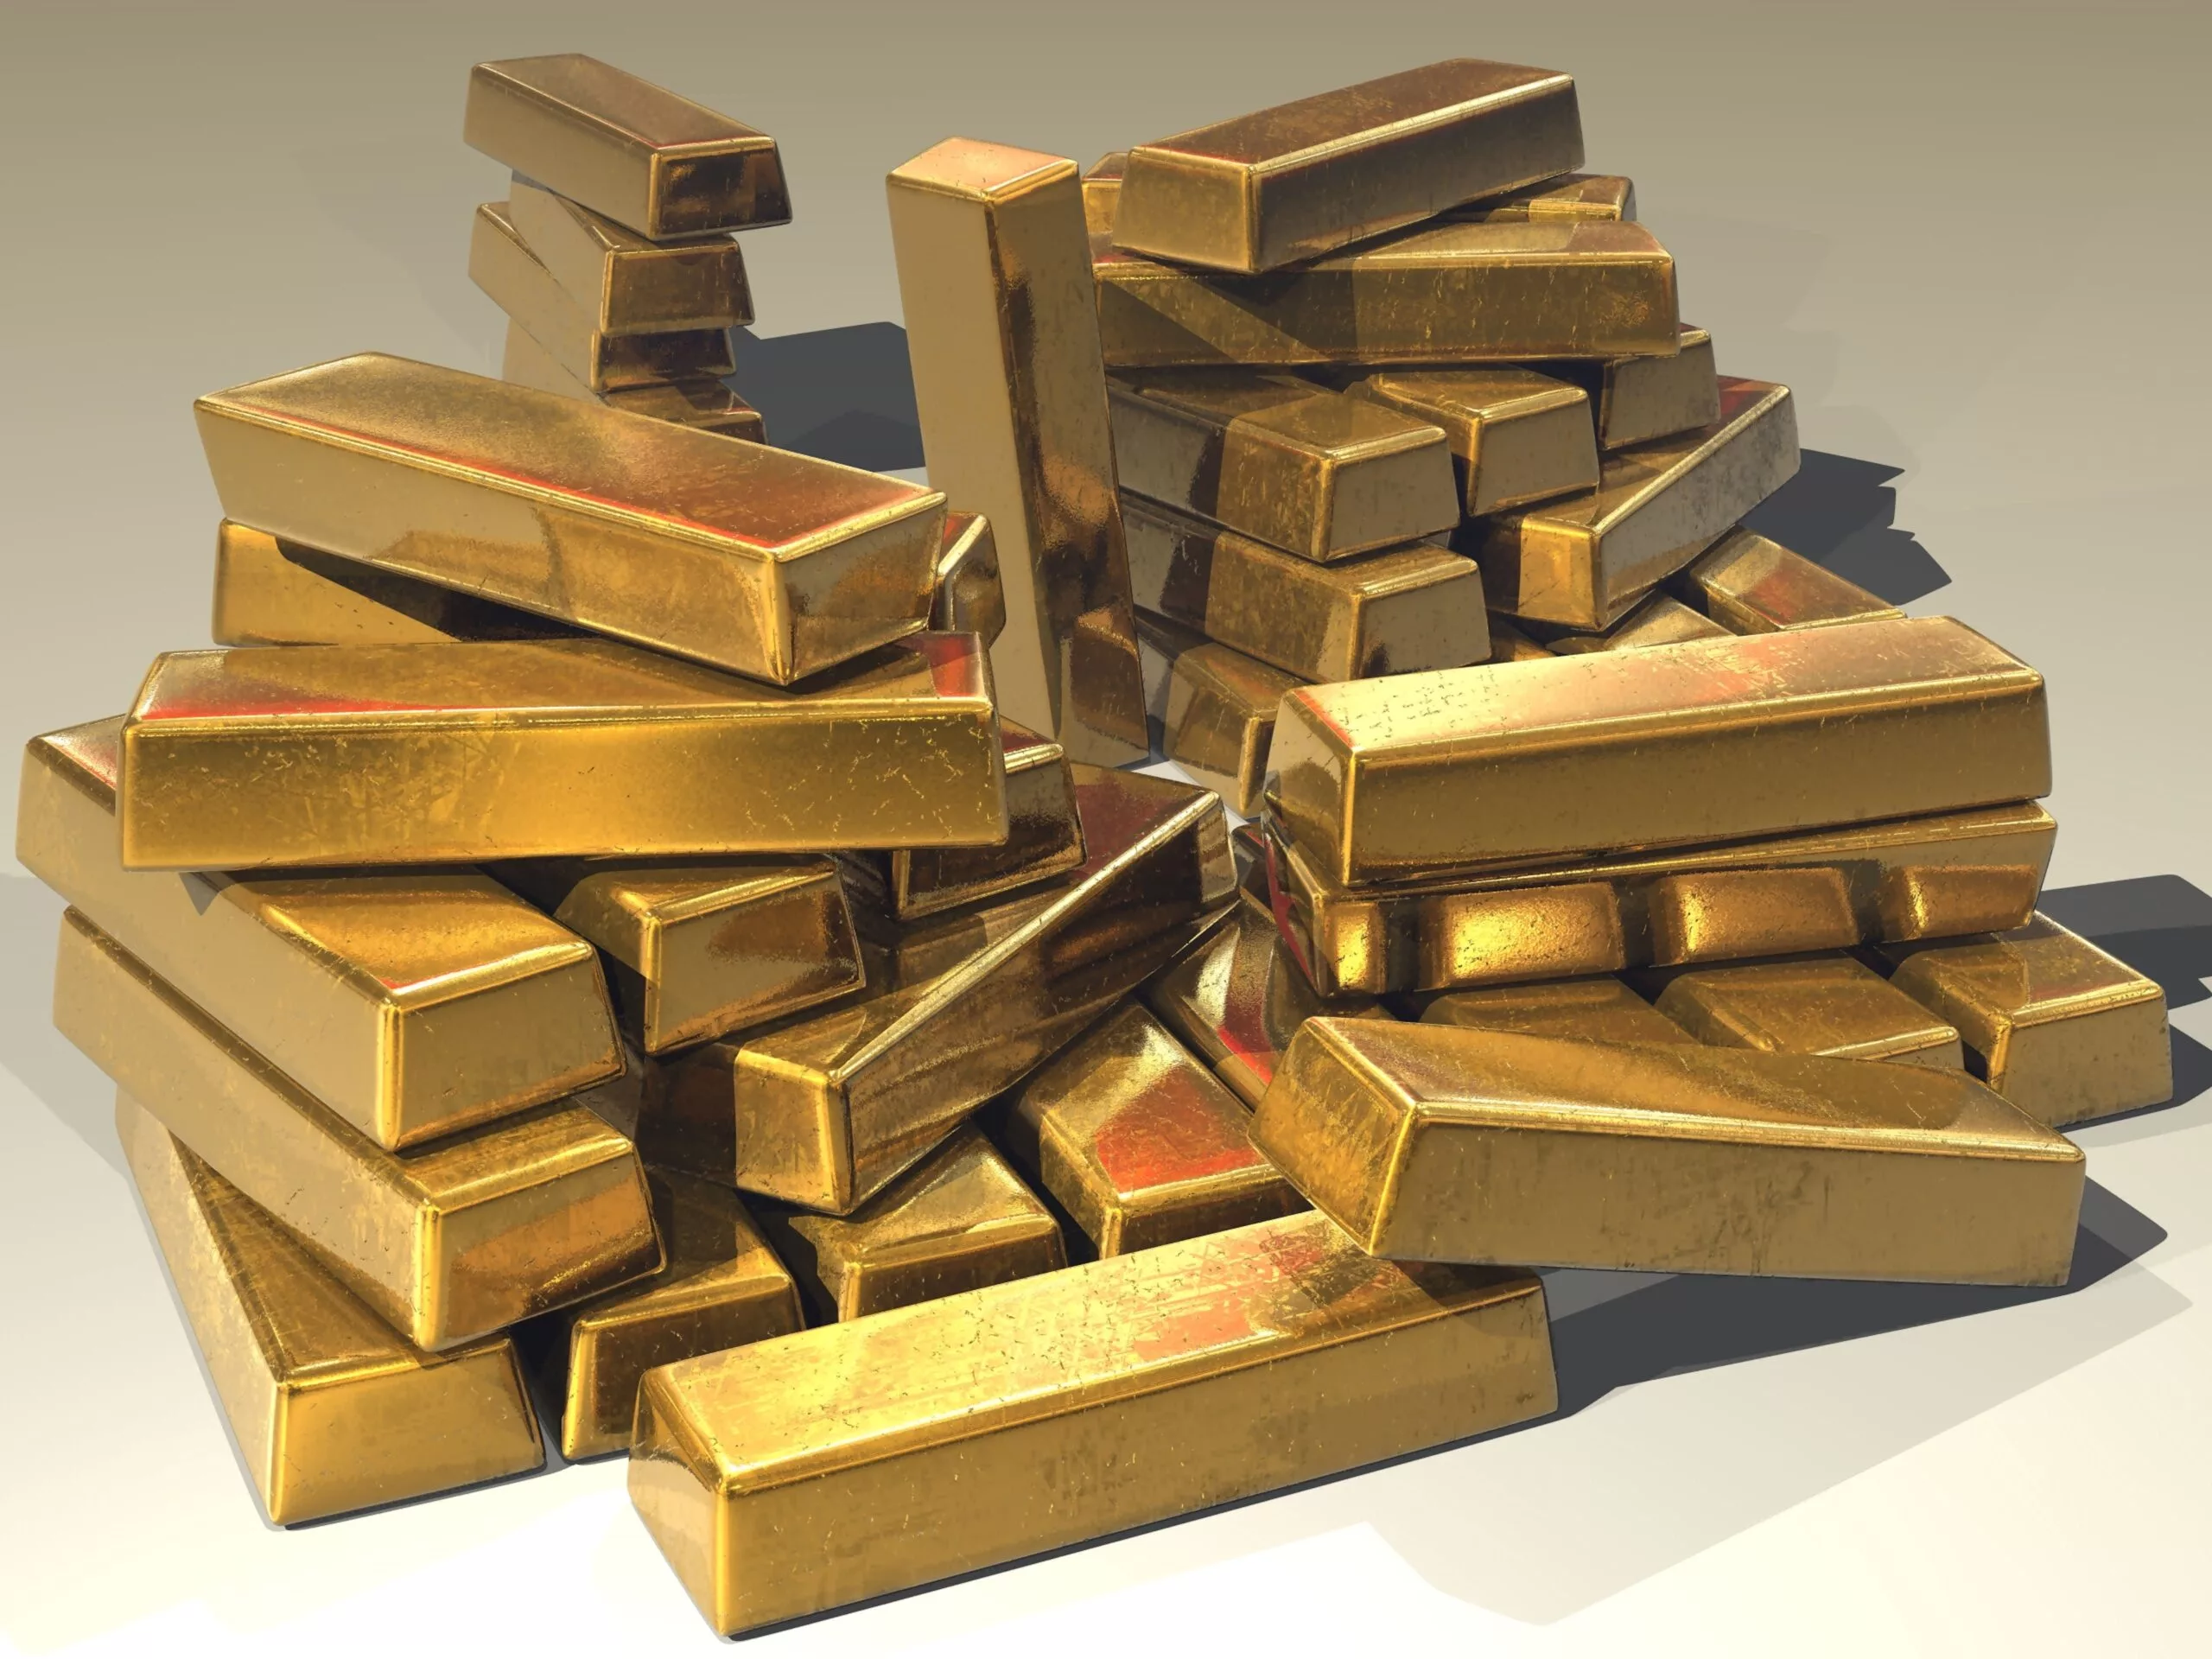
01 The session in one read
In the latest settled session on the EODHD feed, gold closed at 4,118 dollars per ounce, down 0.31% day-on-day, while silver ended at 59.53 dollars per ounce, a 0.43% decline, setting a mildly risk-off tone without any sign of panic. These moves are small in absolute terms but notable in context: they extend a mid-year pullback from January’s peaks and show how sensitive precious metals have become to the ebb and flow of the US dollar and interest rate expectations.
Gold’s price action now looks like consolidation rather than capitulation, with spot values oscillating roughly between 3,900 and 4,300 dollars per ounce after touching an all-time high near 5,000 dollars in late January and then slipping below 4,000 dollars for the first time since November 2025 by late June. Silver, which is traditionally more volatile because it is both a precious and industrial metal, has traced a deeper arc, trading around the 60 dollars area after falling below that level in June and remaining more than 50% under its January 29 record of 121.62 dollars.
Gold and silver are in a classic late-cycle pause: prices remain historically high after the January spike, yet the latest session shows the market reluctant to push further without a clear macro jolt. Higher US Treasury yields, meaning investors earn more interest on government bonds, and a dollar supported by safe-haven demand and expectations of restrictive Federal Reserve policy have capped the appeal of non-yielding bullion in recent weeks. For Latin America, especially Mexico and Peru, this equilibrium still delivers strong export values but complicates new investment decisions, as miners weigh elevated prices against more volatile global financial conditions and shifting safe-haven behaviour, making the path of real yields the variable to watch.
02 The board
Looking at The Rio Times live board below, the key takeaway for a hurried reader is that both gold and silver have nudged lower, not crashed: gold sits at 4,118 dollars per ounce with a daily change of minus 0.31%, and silver at 59.53 dollars per ounce with a move of minus 0.43%, according to the EODHD close data stream. For foreign investors used to seeing price tables, this board serves as a snapshot of how bullion now trades closer to the middle of its recent range rather than the extremes seen during the January surge and the June correction.
Those figures underline how much the story has shifted since earlier in the year: gold is still roughly 21–23% higher than it was a year ago and silver retains a near-60% year-on-year gain, but both have given back substantial ground from their peaks, so the board is showing a market where enthusiasm has cooled even if long-term trends stay positive. In practical terms, for anyone hedging currency or political risk via precious metals, the board reflects a more two-way market where timing and macro awareness matter at least as much as the simple decision to buy.
| Asset | Level | Change |
|---|---|---|
| Gold | 4,118 $/oz | -0.31% |
| Silver | 59.53 $/oz | -0.43% |
Source: EODHD close, 2026-07-23. Where a commodity has no spot feed, an exchange-traded tracker or leading producer is shown as a labelled proxy.
Live Market IntelligenceThe live market board
Rio Times · Live Market Intelligence
Latin America — Cross-Market Board
| Instrument | Last | Change | YoY | Prev. | High | Low | Volume |
|---|---|---|---|---|---|---|---|
| IBOV | 177,547.57 | +2.44% | +32.46% | 173,325.65 | — | — | — |
| IPSA | 11,009.22 | +0.50% | — | 10,954.04 | 11,019 | 10,913 | 1,513,213,483 |
| IPC MEX | 67,298.78 | +0.88% | +21.23% | 66,709.60 | — | — | — |
| MERVAL | 3,379,771 | +2.98% | +68.11% | 3,281,979 | — | — | — |
| COLCAP | 2,297.00 | -0.19% | — | 9.04 | 9.05 | 9.02 | 4,133 |
| BVL PERÚ | 57,575.02 | — | — | — | — | — | — |
| USD/BRL | 5.06 | +0.04% | -9.12% | 5.05 | 5.06 | 5.04 | — |
| EUR/BRL | 5.77 | -0.46% | -11.54% | 5.80 | 5.78 | 5.76 | — |
| USD/MXN | 17.44 | +0.30% | -6.44% | 17.39 | 17.46 | 17.37 | — |
| USD/CLP | 937.27 | +0.18% | -1.36% | 935.60 | 938.15 | 937.15 | — |
| USD/COP | 3,204 | -0.73% | -21.29% | 3,227 | 3,212 | 3,200 | — |
| USD/PEN | 3.39 | -0.30% | -4.71% | 3.40 | 3.40 | 3.39 | — |
| USD/ARS | 1,482 | -0.03% | +18.06% | 1,483 | 1,482 | 1,482 | — |
| USD/UYU | 40.14 | +1.16% | +0.69% | 39.68 | 40.14 | 40.14 | — |
| USD/PYG | 6,035 | +1.38% | -19.46% | 5,954 | 6,035 | 6,035 | — |
| USD/BOB | 10.95 | +3.79% | +62.48% | 10.55 | 10.95 | 10.95 | — |
| USD/DOP | 57.92 | -0.14% | -3.55% | 58.00 | 58.34 | 57.92 | — |
| USD/CRC | 447.42 | +1.35% | -9.14% | 441.44 | 447.42 | 447.42 | — |
03 What moved it
The latest dip in gold and silver is best understood through three basic levers: the US dollar, bond yields and safe-haven flows. A stronger or steadier dollar, often measured via indices against other major currencies, typically pressures dollar-priced metals because buyers in other currencies see their costs rise, and recent safe-haven demand has favoured the greenback over bullion as investors seek liquidity and yield.
At the same time, nominal US Treasury yields and so-called real yields, which adjust for inflation, have climbed on net since the start of the year, with two-year and ten-year yields up around 60 and 35 basis points respectively according to the Federal Reserve’s July Monetary Policy Report. Because gold and silver do not pay interest, higher yields on cash and bonds raise the opportunity cost of holding them, helping explain why gold has struggled to clear psychological resistance around 4,100 dollars per ounce and why silver remains capped even as industrial demand narratives stay broadly supportive.
04 The Latin American read
For Latin America, the silver story is as important as the gold one because the region sits at the heart of global supply: Mexico remained the world’s leading silver mine-producing country in 2024, followed by China and Peru, and global mine output rose 0.9% to 819.7 million ounces thanks partly to recovering Mexican production and growth from Bolivia and the United States. Mexico alone produced 6,300 metric tons of silver in 2024, nearly twice China’s output, while Peru delivered 3,100 metric tons, underscoring how price moves around 60 dollars per ounce feed straight into export revenues, company earnings and local tax receipts.
For foreign investors considering Latin American exposure, this geography matters: mining firms and state finances in Mexico and Peru are leveraged not just to spot prices but also to the same macro forces that now shape bullion globally—US rate expectations, dollar strength and risk appetite. When the dollar attracts safe-haven flows and yields drift higher, the region’s miners may still enjoy strong prices in absolute terms but face tougher funding conditions and more volatile share price performance, turning metals markets into a proxy for broader Latin American risk.
05 The names to watch
From a market structure perspective, the key actors to watch are not only the miners but also central banks, large funds and industrial users whose decisions can shift demand at scale. Central banks have been consistent buyers of gold in recent years, often seeking diversification away from the dollar, and any change in that pattern—perhaps triggered by higher yields or currency pressures—would feed directly into price behaviour and thus into the fortunes of producers across Latin America.
On the silver side, long-term demand tied to electrification and artificial intelligence, including uses in solar panels, electronics and advanced manufacturing, continues to underpin talk of a structural deficit in which consumption outpaces mine supply. That leaves leading producers such as Mexico and Peru sitting at the crossroads of two forces: cyclical macro headwinds that currently restrain prices, and strategic industrial trends that may reassert themselves if the macro backdrop stabilises and speculative selling eases.
06 The outlook
Looking ahead, most institutional and analyst commentary points to gold and silver trading within broad ranges rather than embarking immediately on fresh highs, with one widely cited consensus placing the average gold price near 4,916 dollars per ounce for 2026 and silver consolidating roughly between 54 and 64 dollars per ounce after its dramatic January peak and June correction. Whether the market breaks out of these corridors will depend less on the metals themselves than on the interplay between US monetary policy, the dollar’s role as the preferred safe haven and the resilience of industrial demand for silver, particularly in Latin America’s key mining economies, making real US yields and global risk sentiment the indicators to watch.
07 What to watch
- Dollar as preferred safe haven: Watch whether bouts of geopolitical stress continue to push investors into the US dollar instead of bullion, because this pattern would keep pressure on gold and silver despite their traditional safe-haven reputation.
- US real yields: Monitor inflation-adjusted Treasury yields, since further increases would raise the opportunity cost of holding non-yielding metals and could cap any recovery in gold and silver prices.
- Silver’s industrial demand: Track data on solar installations, electronics production and broader electrification trends, as continued growth here would support silver prices and benefit major producers like Mexico and Peru despite financial-market headwinds.
- Latin American mining investment: Follow capital spending and project approvals in Mexico and Peru, because sustained investment at today’s prices would signal confidence in long-term demand, while delays or cuts would hint at a more cautious outlook tied to dollar strength and rate risks.
Frequently Asked Questions
Why did gold slip even though there is geopolitical tension?
Recent geopolitical episodes have seen investors favour the US dollar and short-term government bonds as their main havens rather than gold, partly because higher interest rates mean cash now pays a visible return, so bullion has struggled to rally despite the tense backdrop.
Why is silver more volatile than gold?
Silver tends to swing more sharply than gold because it is both a precious metal and an industrial input used in sectors such as solar power and electronics, so its price reflects changes in factory demand as well as investment flows, magnifying moves when macro conditions shift.
How important are Mexico and Peru to silver supply?
Mexico is currently the world’s largest silver producer with around 6,300 metric tons of output in 2024, nearly double second-place China, while Peru ranks third with 3,100 metric tons, so together they form the core of global mine supply and are highly exposed to price changes.
Are gold and silver still higher than a year ago?
Yes, despite the mid-year correction, gold remains roughly 21–23% above its level a year earlier and silver retains gains near 60% year-on-year, meaning prices are still elevated in historical terms even if they are well below the extremes seen in January.
In depth
LatAm Markets: Live Signals → — real-time movers, turnover leaders and FX across Latin America.
Read More from The Rio Times