IBOV 177,999.00 ▲ 0.47% IPSA 11,017.49 ▼ 0.12% IPC MEX 67,327.01 ▲ 1.28% MERVAL 3,291,323 ▼ 0.41% COLCAP 2,392.10 ▲ 2.12% BVL PERÚ 57,890.85 — — USD/BRL5.07▲ 0.30% USD/MXN17.33▼ 0.09% USD/CLP930.47▲ 0.47% USD/COP3,152▼ 1.53% USD/PEN3.39▼ 0.05% USD/ARS1,485▼ 0.27% USD/UYU40.20▲ 1.31% USD/PYG5,931▲ 0.69% USD/BOB12.10▲ 8.06% USD/DOP57.99▲ 0.14% USD/CRC448.40▲ 1.30% USD/GTQ7.62▲ 2.31% USD/HNL26.76▲ 0.39% USD/NIO36.62▲ 0.34% USD/VES744.76▼ 0.13% USD/PAB1.00— 0.00% USD/BZD2.00— 0.00% USD/JMD157.19▲ 0.48% USD/TTD6.72▲ 0.83% EUR/BRL5.85▼ 0.37% BRENT 90.12 ▲ 1.22% WTI 86.80 ▲ 3.84% IRON ORE 161.91 — — COPPER 6.51 ▲ 0.98% GOLD 4,099 ▼ 0.04% SILVER 57.78 ▼ 1.77% SOY 1,188 ▲ 0.93% CORN 463.75 ▲ 4.04% WHEAT 638.00 ▼ 3.84% COFFEE 313.55 ▼ 2.94% SUGAR 14.65 ▲ 1.52% ORANGE JUICE 153.35 ▲ 5.03% COTTON 81.20 ▲ 2.25% COCOA 5,394 ▲ 5.52% BEEF 227.00 ▼ 1.83% CATTLE 343.28 ▼ 0.92% LITHIUM 69.22 ▼ 0.85% PETR4 43.42 ▲ 1.35% VALE3 76.28 ▲ 0.25% ITUB4 42.89 ▲ 0.35% BBDC4 18.43 ▲ 0.22% ABEV3 15.99 ▲ 0.19% BBAS3 21.35 ▲ 0.76% B3SA3 15.73 ▲ 0.64% WEGE3 47.20 ▲ 0.81% PRIO3 60.85 ▲ 1.48% SUZB3 43.32 ▲ 1.38% RENT3 37.61 ▼ 1.62% AZZA3 16.42 ▲ 3.53% CSAN3 4.07 ▲ 2.01% RAIZ4 0.26 — 0.00% PCAR3 2.59 ▼ 5.47% GMAT3 4.03 ▲ 1.26% PSSA3 54.70 ▲ 0.64% CVCB3 1.31 ▲ 0.77% POSI3 3.55 ▲ 0.85% SLCE3 13.38 ▲ 0.91% NATU3 8.38 ▲ 0.60% BRKM5 5.97 ▲ 0.67% RANI3 8.11 ▲ 1.00% CSNA3 4.84 ▼ 2.22% CMIN3 5.71 ▼ 0.17% USIM5 7.36 ▼ 2.52% GGBR4 24.98 — 0.00% ENEV3 26.31 ▲ 0.61% CPFE3 46.14 ▲ 0.11% CMIG4 11.34 ▲ 0.98% EQTL3 38.66 — 0.00% LREN3 13.60 ▲ 0.59% VIVT3 32.63 — 0.00% RAIL3 14.44 ▲ 1.12% KLABIN 18.25 ▲ 1.11% RAIA DROGASIL 18.48 ▲ 1.26% RDOR3 34.64 ▲ 0.64% HAPV3 11.28 ▲ 2.45% FLRY3 17.14 ▲ 1.00% SMTO3 14.52 ▲ 0.83% UGPA3 33.05 ▲ 0.39% VBBR3 36.05 ▲ 1.18% BBSE3 41.26 ▲ 0.98% BPAC11 56.80 ▲ 0.32% CURY3 30.09 ▼ 1.02% AERI3 2.15 ▲ 0.94% VIVARA 22.18 ▲ 0.09% COMPASS 24.84 — 0.00% VAMOS 3.34 ▼ 2.34% SANB11 28.62 ▲ 13.35% ASAI3 8.50 ▲ 1.07% SBSP3 27.70 ▲ 1.06% WALMEX 50.36 ▲ 0.34% GMEXICO 208.29 ▼ 2.20% FEMSA 221.95 ▲ 1.19% CEMEX 20.54 ▼ 0.73% GFNORTE 199.64 ▼ 0.32% BIMBO 62.08 ▲ 2.26% TELEVISA 9.79 ▼ 0.91% AMX 22.00 — 0.00% GAP 376.64 ▼ 1.08% ASUR 275.62 ▼ 0.34% OMA 231.05 ▼ 0.96% KOF 187.94 ▼ 0.14% GRUMA 258.23 ▼ 4.00% KIMBER 40.19 ▼ 0.17% SQM-B 62,700 ▼ 0.93% COPEC 6,350 ▲ 0.79% BSANTANDER 80.99 ▲ 0.36% FALABELLA 6,216 ▼ 0.06% ENELAM 87.99 ▲ 0.39% CENCOSUD 1,955 ▲ 0.51% CMPC 1,055 ▲ 2.43% BANCO CHILE 193.71 ▼ 1.57% LATAM AIR 24.74 ▼ 0.64% YPF 82,900 ▲ 1.94% GGAL 7,890 ▼ 1.56% PAMPA 5,555 ▲ 0.36% TXAR 659.50 ▲ 1.77% ALUAR 977.50 ▼ 0.20% TGS 10,050 ▲ 2.45% CEPU 2,396 ▼ 0.33% MIRGOR 16,350 ▼ 1.95% COME 44.03 ▼ 1.94% LOMA NEGRA 3,620 ▼ 1.76% BYMA 296.00 ▼ 0.34% TELECOM ARG 4,408 ▲ 2.14% ECOPETROL 16.77 ▼ 1.58% BANCOLOMBIA 92.52 ▼ 1.46% GRUPO AVAL 5.28 ▲ 2.75% CREDICORP 400.58 ▼ 0.42% SOUTHERN COPPER 182.71 ▼ 1.24% BUENAVENTURA 30.28 ▼ 4.96% MERCADOLIBRE 1,878 ▼ 0.41% NUBANK 14.33 ▼ 1.10% XP 17.06 ▼ 0.81% PAGSEGURO 9.64 ▼ 2.03% STONE 11.38 ▼ 0.48% GLOBANT 36.60 ▲ 0.58% TECNOGLASS 43.44 ▼ 0.34% GAP AIRPORT 217.35 ▼ 1.02% ASUR 275.62 ▼ 0.34% OMA AIRPORT 106.90 ▼ 1.10% AMX ADR 25.37 ▲ 0.18% FEMSA ADR 127.99 ▲ 0.97% CEMEX ADR 11.82 ▼ 0.92% PETROBRAS ADR 19.40 ▲ 1.46% VALE ADR 15.06 ▲ 0.47% ITAU ADR 8.46 ▲ 0.24% SANTANDER BR 5.67 ▲ 12.28% AMBEV ADR 3.11 ▼ 0.32% CSN 0.99 ▼ 2.42% GERDAU 4.96 — 0.00% LATAM ADR 52.75 ▼ 2.21% BTC 62,940 ▼ 2.76% ETH 1,861 ▼ 2.93% SOL 72.78 ▼ 2.27% XRP 1.06 ▼ 2.01% BNB 586.74 ▼ 0.89% ADA 0.17 ▼ 1.05% DOGE 0.07 ▼ 1.15% AVAX 6.40 ▼ 0.53% LINK 8.17 ▼ 3.42% DOT 0.76 ▼ 1.05% LTC 44.49 ▼ 2.31% BCH 209.28 ▼ 3.57% TRX 0.33 ▼ 0.70% XLM 0.17 ▲ 0.20% HBAR 0.07 ▼ 0.09% NEAR 1.66 ▼ 0.91% ATOM 1.23 ▼ 4.34% AAVE 94.19 ▼ 5.28% SELIC 14.25% EMBRAER 86.89 ▲ 0.87% EMBRAER ADR 68.33 ▲ 0.32% JBS 14.02 ▼ 1.89% JBS BDR 70.70 ▼ 2.01% MBRF3 17.54 ▼ 2.34% MBRFY 3.39 ▼ 2.31% INTER 5.60 ▼ 0.71% IBOV 177,999.00 ▲ 0.47% IPSA 11,017.49 ▼ 0.12% IPC MEX 67,327.01 ▲ 1.28% MERVAL 3,291,323 ▼ 0.41% COLCAP 2,392.10 ▲ 2.12% BVL PERÚ 57,890.85 — — USD/BRL 5.07 ▲ 0.30% USD/MXN 17.33 ▼ 0.06% USD/CLP 930.47 ▲ 0.47% USD/COP 3,152 ▼ 1.53% USD/PEN 3.39 ▼ 0.05% USD/ARS 1,485 ▼ 0.27% USD/UYU 40.20 ▲ 1.31% USD/PYG 5,931 ▲ 0.69% USD/BOB 12.10 ▲ 8.06% USD/DOP 57.99 ▲ 0.14% USD/CRC 448.40 ▲ 1.30% USD/GTQ 7.62 ▲ 2.31% USD/HNL 26.76 ▲ 0.39% USD/NIO 36.62 ▲ 0.34% USD/VES 744.76 ▼ 0.13% USD/PAB 1.00 — 0.00% USD/BZD 2.00 — 0.00% USD/JMD 157.19 ▲ 0.37% USD/TTD 6.72 ▲ 0.86% EUR/BRL 5.85 ▼ 0.37% BRENT 90.12 ▲ 1.22% WTI 86.80 ▲ 3.84% IRON ORE 161.91 — — COPPER 6.51 ▲ 0.98% GOLD 4,099 ▼ 0.04% SILVER 57.78 ▼ 1.77% SOY 1,188 ▲ 0.93% CORN 463.75 ▲ 4.04% WHEAT 638.00 ▼ 3.84% COFFEE 313.55 ▼ 2.94% SUGAR 14.65 ▲ 1.52% ORANGE JUICE 153.35 ▲ 5.03% COTTON 81.20 ▲ 2.25% COCOA 5,394 ▲ 5.52% BEEF 227.00 ▼ 1.83% CATTLE 343.28 ▼ 0.92% LITHIUM 69.22 ▼ 0.85% PETR4 43.42 ▲ 1.35% VALE3 76.28 ▲ 0.25% ITUB4 42.89 ▲ 0.35% BBDC4 18.43 ▲ 0.22% ABEV3 15.99 ▲ 0.19% BBAS3 21.35 ▲ 0.76% B3SA3 15.73 ▲ 0.64% WEGE3 47.20 ▲ 0.81% PRIO3 60.85 ▲ 1.48% SUZB3 43.32 ▲ 1.38% RENT3 37.61 ▼ 1.62% AZZA3 16.42 ▲ 3.53% CSAN3 4.07 ▲ 2.01% RAIZ4 0.26 — 0.00% PCAR3 2.59 ▼ 5.47% GMAT3 4.03 ▲ 1.26% PSSA3 54.70 ▲ 0.64% CVCB3 1.31 ▲ 0.77% POSI3 3.55 ▲ 0.85% SLCE3 13.38 ▲ 0.91% NATU3 8.38 ▲ 0.60% BRKM5 5.97 ▲ 0.67% RANI3 8.11 ▲ 1.00% CSNA3 4.84 ▼ 2.22% CMIN3 5.71 ▼ 0.17% USIM5 7.36 ▼ 2.52% GGBR4 24.98 — 0.00% ENEV3 26.31 ▲ 0.61% CPFE3 46.14 ▲ 0.11% CMIG4 11.34 ▲ 0.98% EQTL3 38.66 — 0.00% LREN3 13.60 ▲ 0.59% VIVT3 32.63 — 0.00% RAIL3 14.44 ▲ 1.12% KLABIN 18.25 ▲ 1.11% RAIA DROGASIL 18.48 ▲ 1.26% RDOR3 34.64 ▲ 0.64% HAPV3 11.28 ▲ 2.45% FLRY3 17.14 ▲ 1.00% SMTO3 14.52 ▲ 0.83% UGPA3 33.05 ▲ 0.39% VBBR3 36.05 ▲ 1.18% BBSE3 41.26 ▲ 0.98% BPAC11 56.80 ▲ 0.32% CURY3 30.09 ▼ 1.02% AERI3 2.15 ▲ 0.94% VIVARA 22.18 ▲ 0.09% COMPASS 24.84 — 0.00% VAMOS 3.34 ▼ 2.34% SANB11 28.62 ▲ 13.35% ASAI3 8.50 ▲ 1.07% SBSP3 27.70 ▲ 1.06% WALMEX 50.36 ▲ 0.34% GMEXICO 208.29 ▼ 2.20% FEMSA 221.95 ▲ 1.19% CEMEX 20.54 ▼ 0.73% GFNORTE 199.64 ▼ 0.32% BIMBO 62.08 ▲ 2.26% TELEVISA 9.79 ▼ 0.91% AMX 22.00 — 0.00% GAP 376.64 ▼ 1.08% ASUR 275.62 ▼ 0.34% OMA 231.05 ▼ 0.96% KOF 187.94 ▼ 0.14% GRUMA 258.23 ▼ 4.00% KIMBER 40.19 ▼ 0.17% SQM-B 62,700 ▼ 0.93% COPEC 6,350 ▲ 0.79% BSANTANDER 80.99 ▲ 0.36% FALABELLA 6,216 ▼ 0.06% ENELAM 87.99 ▲ 0.39% CENCOSUD 1,955 ▲ 0.51% CMPC 1,055 ▲ 2.43% BANCO CHILE 193.71 ▼ 1.57% LATAM AIR 24.74 ▼ 0.64% YPF 82,900 ▲ 1.94% GGAL 7,890 ▼ 1.56% PAMPA 5,555 ▲ 0.36% TXAR 659.50 ▲ 1.77% ALUAR 977.50 ▼ 0.20% TGS 10,050 ▲ 2.45% CEPU 2,396 ▼ 0.33% MIRGOR 16,350 ▼ 1.95% COME 44.03 ▼ 1.94% LOMA NEGRA 3,620 ▼ 1.76% BYMA 296.00 ▼ 0.34% TELECOM ARG 4,408 ▲ 2.14% ECOPETROL 16.77 ▼ 1.58% BANCOLOMBIA 92.52 ▼ 1.46% GRUPO AVAL 5.28 ▲ 2.75% CREDICORP 400.58 ▼ 0.42% SOUTHERN COPPER 182.71 ▼ 1.24% BUENAVENTURA 30.28 ▼ 4.96% MERCADOLIBRE 1,878 ▼ 0.41% NUBANK 14.33 ▼ 1.10% XP 17.06 ▼ 0.81% PAGSEGURO 9.64 ▼ 2.03% STONE 11.38 ▼ 0.48% GLOBANT 36.60 ▲ 0.58% TECNOGLASS 43.44 ▼ 0.34% GAP AIRPORT 217.35 ▼ 1.02% ASUR 275.62 ▼ 0.34% OMA AIRPORT 106.90 ▼ 1.10% AMX ADR 25.37 ▲ 0.18% FEMSA ADR 127.99 ▲ 0.97% CEMEX ADR 11.82 ▼ 0.92% PETROBRAS ADR 19.40 ▲ 1.46% VALE ADR 15.06 ▲ 0.47% ITAU ADR 8.46 ▲ 0.24% SANTANDER BR 5.67 ▲ 12.28% AMBEV ADR 3.11 ▼ 0.32% CSN 0.99 ▼ 2.42% GERDAU 4.96 — 0.00% LATAM ADR 52.75 ▼ 2.21% BTC 62,940 ▼ 2.76% ETH 1,861 ▼ 2.93% SOL 72.78 ▼ 2.27% XRP 1.06 ▼ 2.01% BNB 586.74 ▼ 0.89% ADA 0.17 ▼ 1.05% DOGE 0.07 ▼ 1.15% AVAX 6.40 ▼ 0.53% LINK 8.17 ▼ 3.42% DOT 0.76 ▼ 1.05% LTC 44.49 ▼ 2.31% BCH 209.28 ▼ 3.57% TRX 0.33 ▼ 0.70% XLM 0.17 ▲ 0.20% HBAR 0.07 ▼ 0.09% NEAR 1.66 ▼ 0.91% ATOM 1.23 ▼ 4.34% AAVE 94.19 ▼ 5.28% SELIC 14.25% EMBRAER 86.89 ▲ 0.87% EMBRAER ADR 68.33 ▲ 0.32% JBS 14.02 ▼ 1.89% JBS BDR 70.70 ▼ 2.01% MBRF3 17.54 ▼ 2.34% MBRFY 3.39 ▼ 2.31% INTER 5.60 ▼ 0.71%
since 2009
Friday, July 31, 2026

Usiminas Q2 Profit Triples to US$85 Million on Margin Gains

By · July 30, 2026 · 6 min read

Daily Brief

The morning intel from across Latin America. Free.

By subscribing you agree to our privacy policy. We never share your email.

Brazil · Business

Key Facts

Net profit. R$428 million (~US$85 million) in Q2 2026, up 236% year-on-year.

Adjusted EBITDA. R$761 million (~US$150 million), an 86% annual increase.

Margin. Adjusted EBITDA margin of 12%, a gain of 6.3 percentage points.

Revenue. Net revenue of R$6.131 billion (~US$1.21 billion), down 7% on the year.

Balance sheet. Net cash of R$499 million (~US$99 million), up 27.8% from R$391 million (~US$77 million).

Brazilian flat-steel producer Usiminas more than tripled its bottom line in the second quarter of 2026, reporting net profit of R$428 million (~US$85 million) on 30 July, a 236% jump on the same period of 2025. The result came despite falling revenue, marking a quarter won on costs and margins rather than volumes. USIM5 shares rose 3.7% in São Paulo on the day.

Investors welcomed the sharp earnings improvement as a sign that management’s focus on efficiency is paying off. The stock’s gain outpaced the broader Ibovespa index, reflecting optimism that the margin recovery could gain further traction in coming quarters.
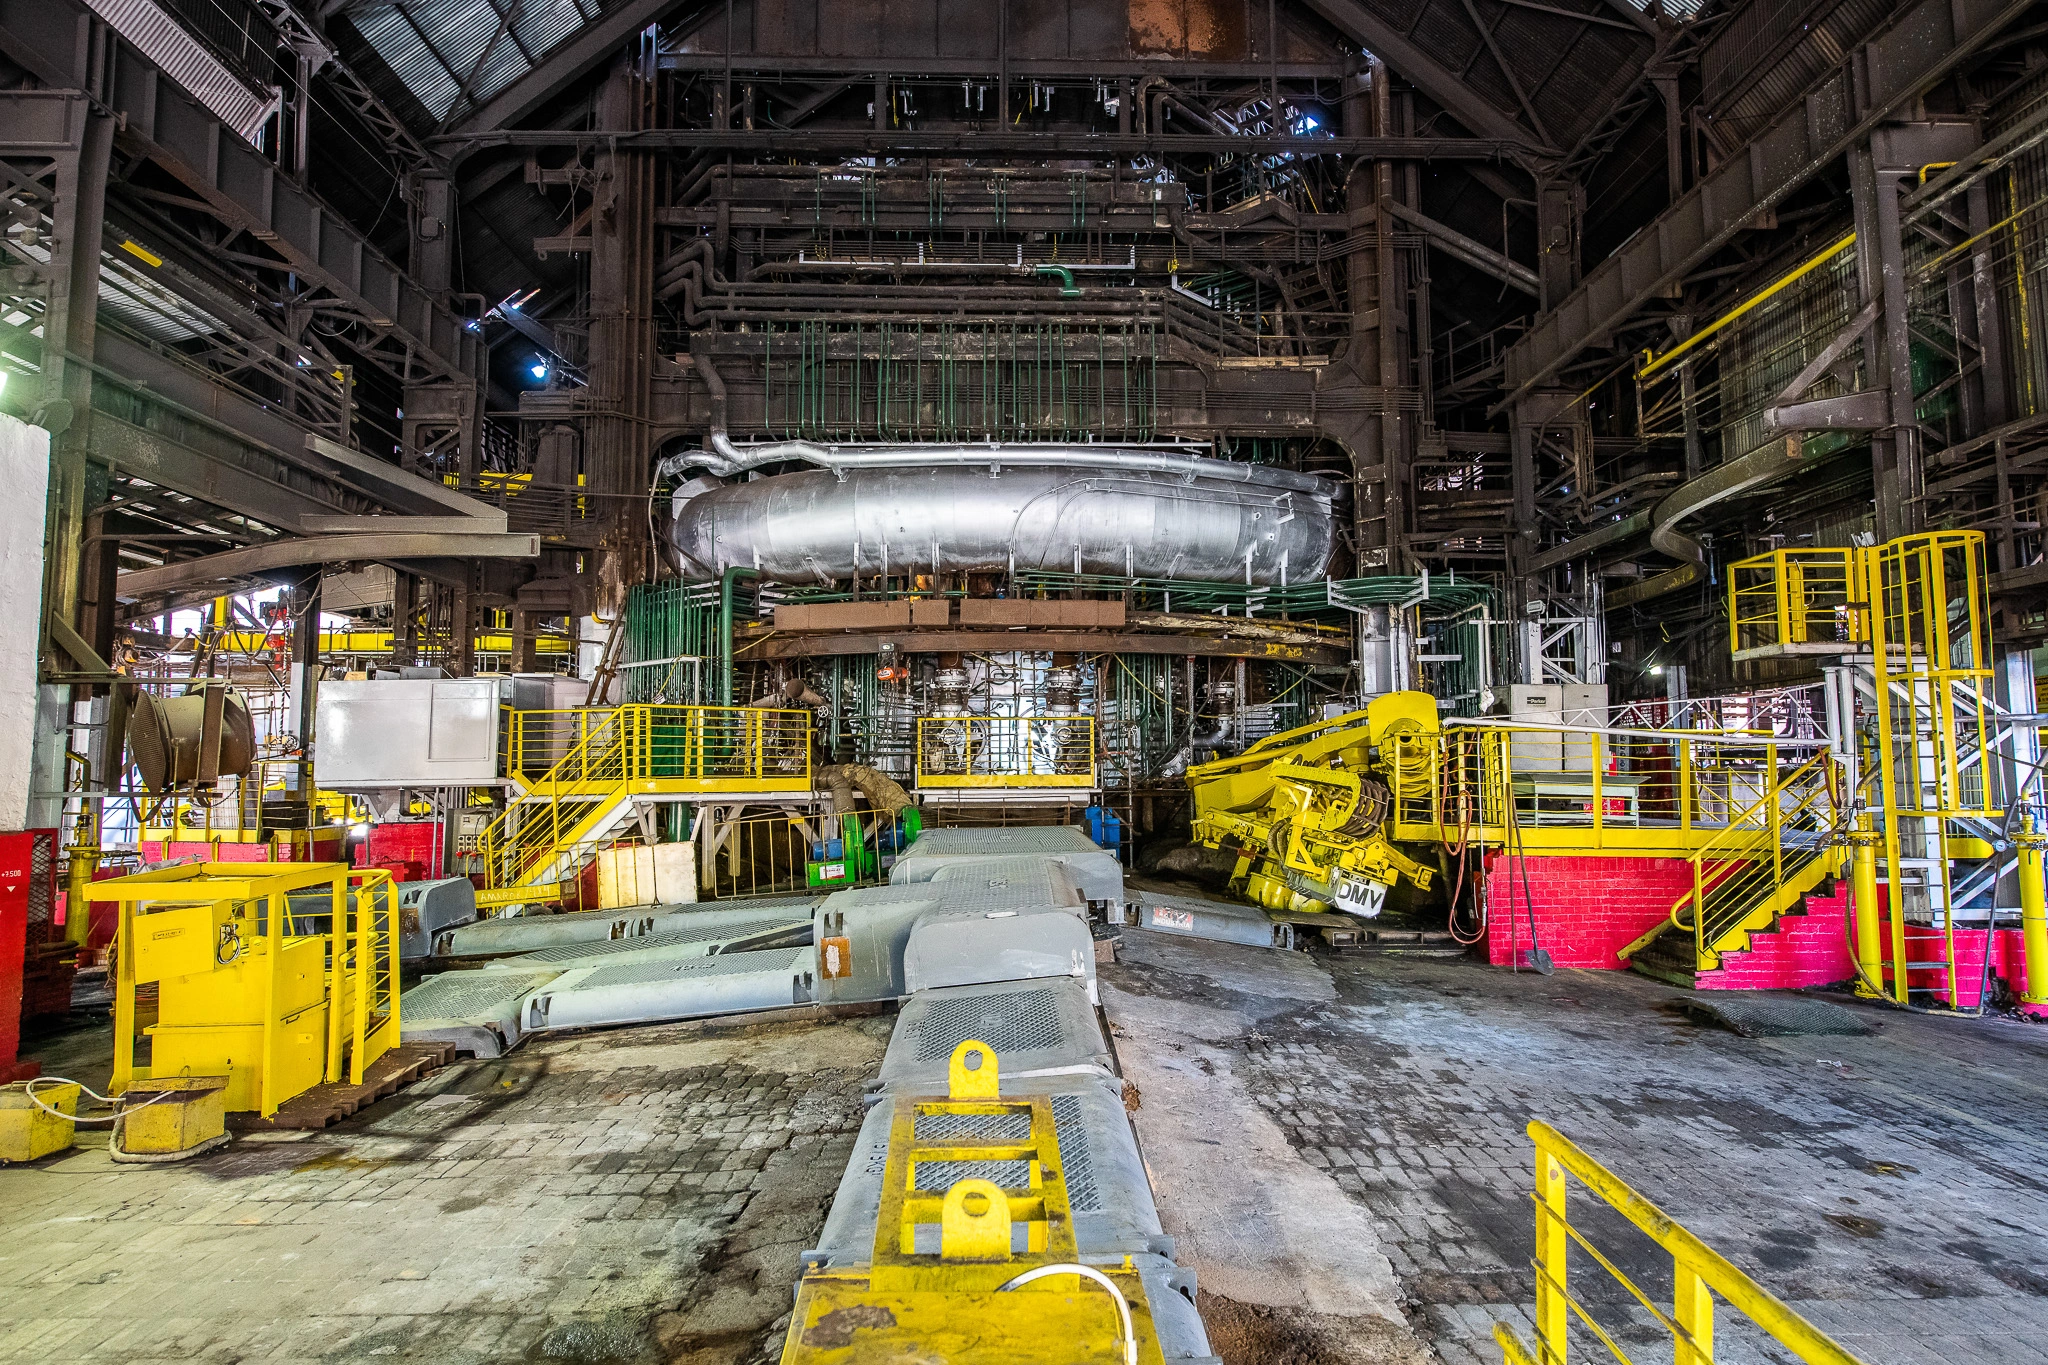
Usiminas Q2 Profit Triples to US$85 Million on Margin Gains. (Photo internet reproduction)
RT
Ask Rio Times
Latin American markets, currencies and companies.
Open the full Ask Rio Times →

Why Usiminas Profit Tripled on Falling Revenue

The gap between the profit line and the revenue line is the quarter’s defining feature. Net revenue fell 7% year-on-year to R$6.131 billion (~US$1.21 billion), while adjusted EBITDA climbed 86% to R$761 million (~US$150 million).

That pushed the adjusted EBITDA margin to 12%, an improvement of 6.3 percentage points. For a steelmaker, a margin move of that size in twelve months reflects input costs, product mix and overhead discipline rather than any recovery in end demand. The company sold less steel for less money and kept substantially more of it.

On the cost side, the company benefited from a more favorable pricing environment for coking coal and iron ore, key raw materials. Simultaneously, a conscious shift toward higher-margin coated steels for the automotive and home appliance sectors lifted the average realization per ton sold.

The richer mix was visible in the steady migration away from commoditized hot-rolled coil toward value-added products. These segments typically carry wider spreads and more resilient demand, shielding Usiminas from the worst of spot-market volatility.

How the Balance Sheet Improved

Usiminas posted a negative financial result of R$45 million (~US$8.9 million), a 20% improvement on the same quarter of 2025.

It closed June in a net cash position of R$499 million (~US$99 million), up from R$391 million (~US$77 million) three months earlier — cash and equivalents exceeding gross debt.

That is a comfortable place for a cyclical producer heading into an uncertain half. It gives the company room to fund capital spending without returning to debt markets while Brazil’s Selic rate sits at 14.25%.

The negative financial result of R$45 million primarily reflected interest expense on legacy debt and foreign exchange variations. A 20% improvement from the prior year signalled that the company’s net cash position was increasingly insulating it from market turbulence.

With borrowing costs elevated, Usiminas’ ability to self-fund its capital expenditure program preserves shareholder value. Management has previously earmarked investments for blast furnace relining and efficiency upgrades, projects that will sustain future competitiveness.

Live Company IntelligenceUsinas Siderúrgicas de Minas Gerais S.A. — the full investor dossierInside: live share price, market cap, three-year financials, valuation, ESG and peer benchmarks — plus the latest Rio Times coverage.
U
◆ Live Company Intelligence
Usinas Siderúrgicas de Minas Gerais
SA: USIM5USIM5Basic MaterialsSteel
R$9.29B
Market cap

Valuation & profitability

Market capR$9.29B
Revenue (TTM)R$25.28B
Profit margin-10.3%
Return on equity-9.3%

Price & risk

52-wk low
$3.92
52-wk high
$12.18
Beta (volatility)1.21
200-day average$7.25

Revenue trend · 6y

20202025
Latest R$26.36B

Ownership

Institutions47.4%
Shares outstanding528M

Dividend

No regular dividend — earnings reinvested for growth.
What Usinas Siderúrgicas de Minas Gerais does. Usinas Siderúrgicas de Minas Gerais S.A. operates in the steel industry and related activities in Brazil and internationally. It operates in two segments, Steel Metallurgy and Mining, and Logistics. The company offers thick plates, hot strips, colled rolled, electrogalvanized, and hot dip galvanized products for the automotive, construction, distribution, energy, oil and…
Data: EODHD fundamentals (USIM5.SA) · figures in BRL · as of 31 Jul 2026More company intelligence →

What the Import Dispute Means for the Second Half

Usiminas has spent two years pressing Brazilian authorities over what it calls unfair competition from imported flat steel, principally from China, and has repeatedly tied pressure on its steelmaking unit to import volumes and the pace of antidumping action in Brasília.

That backdrop shapes the second half. Latin American steel prices moved this week on renewed China tariff concerns, and the sector’s margin recovery rests partly on trade measures that remain unresolved.

The company has been vocal in trade bodies, arguing that subsidized Chinese steel undermines the domestic industry’s viability. A decision on provisional antidumping duties is expected later this year, which could shift the competitive landscape.

For Usiminas, any tightening of import rules would directly support its steelmaking division’s utilization rates. Until a ruling materializes, the overhang of low-priced Asian material will keep a lid on domestic pricing power.

Connected Coverage

Latin America Steel Prices Hit by China Tariff Fears · Iron Ore Wrap: Vale, Rio Tinto Diverge as China Holds Steady

Looking ahead, management will likely stay cautious in its guidance, given the uncertain global trade environment. However, the strong cash generation and margin momentum provide a buffer against a potential demand slowdown.

The second-quarter performance marks a turning point for Usiminas, illustrating that a leaner cost structure can generate substantial profits even amid top-line pressure. Investors are now eyeing the second half for confirmation that these margin levels are sustainable.

What Drives the Differences in Reported Numbers

The sharp quarter-on-quarter net profit decline, despite stronger operating EBITDA, stems from weaker financial results and the absence of deferred tax benefits seen in Q1 2026.

Analyst breakdowns also reveal approximately R$70 million in non-recurring gains inside the steel division’s EBITDA, meaning the sustainable recurring margin is slightly lower than the official 12% figure.

Hidden Costs Foreigners Underestimate

Corporate results like Usiminas’ R$428 million net profit do not capture the heavy tax and logistics burdens embedded in Brazil’s steel supply chain, which inflate final prices for imported construction materials.

According to verified Q2 2026 data, domestic steel EBITDA margins reached roughly 13% while mining margins weakened, signaling that cost pressures are unevenly distributed across the production chain.

How to Choose a City for Your Budget

Industrial results offer indirect budget signals: the steel division’s net revenue of R$5.384 billion and a 4% quarter-on-quarter revenue uptick suggest steel-linked construction costs in Brazil’s industrial southeast may stabilize or rise modestly.

In contrast, a weaker mining segment cautions that mineral-export hubs may see slower local economic activity, potentially creating more rental negotiation power for foreigners in those regions.

Frequently Asked Questions

Why did Usiminas profit fall versus the previous quarter when revenue rose?

Verified research shows consolidated net profit dropped roughly 52% from Q1 2026 despite net revenue increasing about 4% quarter-on-quarter, mainly due to weaker financial results and the non-repeat of deferred tax benefits from earlier in 2026.

How can a company triple its annual profit on falling revenue?

The 236% year-on-year profit jump was won on costs and margins rather than volumes, as net revenue fell 7% versus Q2 2025 to R$6.131 billion (~US$1.21 billion) while adjusted EBITDA surged 86% to R$761 million.

Does the 12% EBITDA margin include one-time gains?

According to analyst notes, the official 12% consolidated adjusted EBITDA margin includes roughly R$70 million in non-recurring steel division gains from a judicial award and an asset sale, putting the recurrent steel EBITDA closer to R$618–631 million.

What was the market’s immediate reaction to these results?

USIM5 shares rose 3.7% in São Paulo on the day of the 30 July release, outpacing the broader Ibovespa index as investors welcomed the sharp earnings improvement driven by management’s efficiency focus.

Read More from The Rio Times

The Rio Times · Power Map
See who really holds power in Latin America
Click to open the Power Map

Rotate for Best Experience

This report is optimized for landscape viewing. Rotate your phone for the full experience.