236% Profit Surge at Brazilian Steelmaker Usiminas Hits US$84M
Markets: São Paulo
Key Facts
—Profit. Usiminas reported net income of R$428 million (about US$84 million) in the second quarter of 2026, up about 236% from a year earlier.
—EBITDA. Adjusted EBITDA rose to R$761 million (about US$150 million), up about 86% year over year, with the margin widening to 12.4%.
—Revenue. Net revenue was R$6.13 billion (about US$1.21 billion), down roughly 7% from a year earlier.
—Shares. Despite the profit beat, USIM5 shares fell on results day and BofA and Safra cut their recommendations on a cautious second-half view.
—Cash. Free cash flow was positive but modest at R$35 million (about US$7 million), with net cash of about R$499 million (about US$98 million).
Usiminas booked a Usiminas Q2 profit of R$428 million (about US$84 million), up about 236% from a year earlier, yet its shares fell as analysts warned of a tougher second half for margins and cash generation.
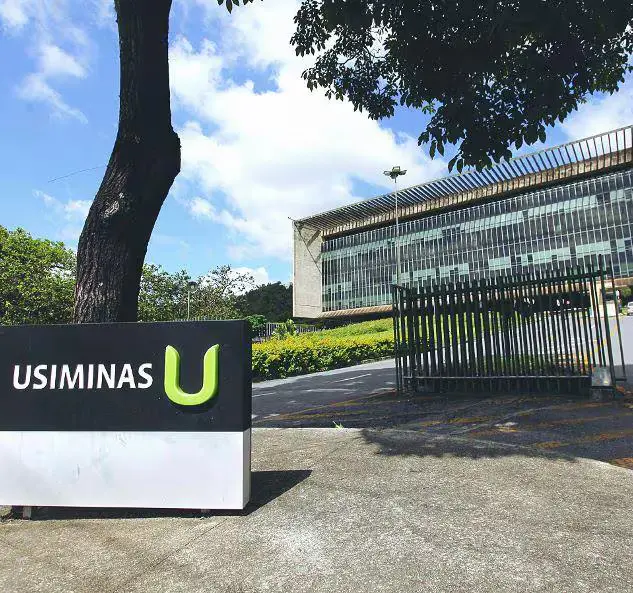
Usiminas Q2 Profit Jumps 236%
The Minas Gerais steelmaker reported net income of R$428 million (about US$84 million) between April and June, up about 236% from the same quarter of 2025. Adjusted EBITDA reached R$761 million (about US$150 million), up about 86% year over year and 17% from the first quarter.
The adjusted EBITDA margin widened to 12.4%, from 11.1% in the first quarter and just 6.2% a year earlier. Net revenue was R$6.13 billion (about US$1.21 billion), down roughly 7% from a year earlier as prices and volumes normalized.
Usinas Siderúrgicas de Minas Gerais, known as Usiminas, is a leading maker of flat steel for Brazil’s auto and appliance industries, and also mines iron ore through its Mineração Usiminas unit.
Why the Bottom Line Improved
Management credited a gradual recovery in profitability to advances in its industrial operations, rigorous cost control, higher productivity and a commercial strategy focused on higher-value products and market diversification.
Steel EBITDA rose about 26% from the first quarter on a better product mix and firmer pricing. The company also trimmed its 2026 capital-spending guidance to a range of R$1.2 billion to R$1.4 billion (about US$236 million to US$276 million).
One caveat on the headline: net income fell from R$896 million (about US$176 million) in the first quarter, which had carried non-recurring gains. The eye-catching 236% figure is a year-on-year comparison, not a sequential one.
Live Market IntelligenceBrazil — Live Market Board
Rio Times · Live Market Intelligence
Brazil — Live Market Board
-0.27%
183,476.86
-0.27%
64,651.92
+0.60%
11,255.90
-0.39%
2,893,751
-1.57%
2,584.72
-0.95%
59,934.37
+1.27%
| Instrument | Last | Change | YoY | Prev. | High | Low | Volume |
|---|---|---|---|---|---|---|---|
| IBOV | 183,476.86 | -0.27% | +21.85% | 183,965.91 | 168,310 | 167,142 | — |
| USD/BRL | 5.16 | +0.01% | -5.13% | 5.16 | 5.18 | 5.14 | — |
| SELIC | 14.00% | — | — | — | — | — | |
| PETR4 | 41.64 | -0.05% | +35.19% | 41.66 | 41.97 | 41.15 | 41,499,400 |
| VALE3 | 72.97 | +0.83% | +30.75% | 72.37 | 73.54 | 72.66 | 17,658,000 |
| ITUB4 | 38.60 | -1.03% | +4.57% | 39.00 | 39.34 | 38.39 | 29,487,800 |
| BBDC4 | 16.85 | +0.36% | +3.50% | 16.79 | 16.90 | 16.67 | 19,416,900 |
| BBAS3 | 19.37 | +0.47% | +0.73% | 19.28 | 19.44 | 19.16 | 11,069,200 |
| B3SA3 | 14.26 | -0.21% | +12.73% | 14.29 | 14.47 | 14.11 | 33,037,800 |
| ABEV3 | 14.89 | -0.80% | +21.91% | 15.01 | 15.07 | 14.81 | 16,453,100 |
| WEGE3 | 47.59 | +0.49% | +29.99% | 47.36 | 48.08 | 47.36 | 3,364,600 |
| PRIO3 | 59.14 | -0.19% | +50.67% | 59.25 | 59.81 | 58.74 | 3,325,600 |
| SUZB3 | 41.33 | +2.35% | -23.55% | 40.38 | 41.48 | 40.35 | 3,914,900 |
| RENT3 | 34.68 | -0.09% | +0.84% | 34.71 | 34.96 | 34.35 | 7,979,100 |
| AZZA3 | 15.89 | -2.63% | -53.76% | 16.32 | 16.42 | 15.82 | 1,330,300 |
| CSNA3 | 4.30 | +0.47% | -42.65% | 4.28 | 4.41 | 4.26 | 10,076,100 |
| GGBR4 | 24.69 | +2.19% | +51.38% | 24.16 | 24.85 | 24.18 | 7,047,600 |
| ENEV3 | 24.21 | -1.38% | +70.49% | 24.55 | 24.64 | 23.99 | 9,297,000 |
Shares Fell Despite the Beat
Even with the profit jump, Usiminas (USIM5) shares dropped on the day of the results as investors looked past the quarter to the outlook. The stock fell several percent intraday, and BofA and Safra both cut their recommendations.
Free cash flow was positive but modest at R$35 million (about US$7 million), and the company held net cash of about R$499 million (about US$98 million). Some investors had hoped for stronger cash generation given the profit surge.
The reaction shows how markets often reward or punish guidance more than the reported quarter, especially in a cyclical industry like steel.
The Warning Signs for the Second Half
Management guided to broadly stable steel results in the third quarter, excluding one-off items, and warned that expected gains in domestic volumes and industrial prices could be fully offset by higher raw-material costs.
The mining arm faces freight pressure and a weaker contribution, and analysts flagged a more challenging second half of costs and pricing. That mix is what unsettled the market despite the strong first-half finish.
In short, the debate is whether Usiminas can keep raising steel prices fast enough to cover rising input costs while its iron-ore business softens.
Context: Brazil’s Steel Squeeze
Like its peers, Usiminas is battling a wave of cheap imports, much of it Chinese, and the industry has lobbied Brasília for stronger trade protection. Domestic demand tied to autos, appliances and machinery has recovered only unevenly.
For foreign investors, the quarter captures the sector’s push and pull: real operational gains and margin recovery, set against import competition and volatile input costs.
Usiminas remains a bellwether for Brazilian heavy industry, so its cautious tone carries weight beyond a single balance sheet.
What Comes Next
The key variables into year-end are steel price increases, raw-material cost inflation, freight costs weighing on mining and any government move on imports. Investors will watch whether margins hold near second-quarter levels.
Analyst views are mixed: some remain constructive on valuation, while others see limited near-term upside after the downgrades. The strong quarter buys goodwill, but the outlook will drive the stock.
More: Brazil news in English, every day from The Rio Times.
Frequently Asked Questions
How much did Usiminas earn in the second quarter of 2026?
Usiminas reported net income of R$428 million (about US$84 million), up about 236% from a year earlier, with adjusted EBITDA of R$761 million (about US$150 million).
Why did Usiminas shares fall despite higher profit?
Investors focused on a cautious second-half outlook — higher raw-material costs and weaker mining — and BofA and Safra cut their recommendations, outweighing the profit beat.
What is Usiminas’s cash position?
Free cash flow was positive but modest at R$35 million (about US$7 million), and the company held net cash of about R$499 million (about US$98 million).
Sources
InfoMoney · Suno · Seu Dinheiro · Finance News · Investing.com
Connected Coverage
More Brazil business and markets coverage from The Rio Times.
Sources: InfoMoney; Suno; Seu Dinheiro; Finance News; Investing.com; Money Times.
This article was produced by The Rio Times’ automated newsroom system. How we use AI · Report an error
LatAm Markets: Live Signals → — real-time movers, turnover leaders and FX across Latin America.
Read More from The Rio Times