IBOV 185,147.15 ▼ 0.02% IPSA 11,315.26 ▼ 1.14% IPC MEX 64,866.61 ▼ 0.87% MERVAL 3,049,121 ▼ 0.29% COLCAP 2,544.56 ▲ 0.40% BVL PERÚ 59,978.22 ▼ 0.31% USD/BRL5.12▼ 0.03% USD/MXN16.88▼ 0.03% USD/CLP933.68— 0.00% USD/COP3,124▼ 0.88% USD/PEN3.35▼ 0.01% USD/ARS1,509— 0.00% USD/UYU40.24▲ 1.33% USD/PYG5,947▲ 2.52% USD/BOB12.40▲ 3.56% USD/DOP59.00▲ 0.85% USD/CRC448.67▲ 1.78% USD/GTQ7.63▲ 2.28% USD/HNL26.84▲ 0.28% USD/NIO36.62▲ 0.07% USD/VES805.37▼ 0.90% USD/PAB1.00— 0.00% USD/BZD2.00— 0.00% USD/JMD 157.28 — 0.00% USD/TTD6.71▲ 1.02% EUR/BRL5.95▲ 0.91% BRENT 88.88 ▼ 0.03% WTI 83.11 ▼ 0.11% IRON ORE 161.91 — — COPPER 6.61 ▲ 0.03% GOLD 4,461 ▲ 1.78% SILVER 65.59 ▲ 1.26% SOY 1,184 ▲ 3.20% CORN 480.50 ▲ 10.02% WHEAT 655.00 ▲ 3.93% COFFEE 317.25 ▼ 5.51% SUGAR 16.43 ▼ 1.79% ORANGE JUICE 138.55 ▼ 0.47% COTTON 85.03 ▲ 2.33% COCOA 5,719 ▲ 3.18% BEEF 223.60 ▼ 3.93% CATTLE 339.10 ▼ 3.16% LITHIUM 75.20 ▲ 1.47% PETR4 41.64 ▼ 0.05% VALE3 72.97 ▲ 0.83% ITUB4 38.60 ▼ 1.03% BBDC4 16.85 ▲ 0.36% ABEV3 14.89 ▼ 0.80% BBAS3 19.37 ▲ 0.47% B3SA3 14.26 ▼ 0.21% WEGE3 47.59 ▲ 0.49% PRIO3 59.14 ▼ 0.19% SUZB3 41.33 ▲ 2.35% RENT3 34.68 ▼ 0.09% AZZA3 15.89 ▼ 2.63% CSAN3 3.22 ▼ 1.83% RAIZ4 0.25 — 0.00% PCAR3 2.75 ▼ 0.36% GMAT3 3.65 ▼ 1.08% PSSA3 48.13 ▼ 0.54% CVCB3 1.33 ▼ 2.92% POSI3 3.36 ▲ 2.44% SLCE3 13.34 ▲ 0.30% NATU3 8.14 ▼ 0.73% IBOV 185,147.15 ▼ 0.02% IPSA 11,315.26 ▼ 1.14% IPC MEX 64,866.61 ▼ 0.87% MERVAL 3,049,121 ▼ 0.29% COLCAP 2,544.56 ▲ 0.40% BVL PERÚ 59,978.22 ▼ 0.31% USD/BRL 5.16 ▲ 0.01% USD/MXN 17.06 ▼ 0.24% USD/CLP 913.98 ▲ 0.04% USD/COP 3,140 ▲ 0.03% USD/PEN 3.36 ▼ 0.66% USD/ARS 1,493 ▲ 0.10% USD/UYU 40.27 ▲ 1.24% USD/PYG 5,939 ▲ 1.68% USD/BOB 11.64 ▼ 0.76% USD/DOP 58.34 ▲ 1.25% USD/CRC 445.92 ▲ 0.89% USD/GTQ 7.62 ▲ 2.21% USD/HNL 26.79 ▲ 1.57% USD/NIO 36.62 ▲ 0.69% USD/VES 762.44 ▼ 0.13% USD/PAB 1.00 — 0.00% USD/BZD 2.00 — 0.00% USD/JMD 157.28 — 0.00% USD/TTD 6.70 ▲ 0.61% EUR/BRL 5.95 ▲ 1.01% BRENT 88.88 ▼ 0.03% WTI 83.11 ▼ 0.11% IRON ORE 161.91 — — COPPER 6.61 ▲ 0.03% GOLD 4,461 ▲ 1.78% SILVER 65.59 ▲ 1.26% SOY 1,184 ▲ 3.20% CORN 480.50 ▲ 10.02% WHEAT 655.00 ▲ 3.93% COFFEE 317.25 ▼ 5.51% SUGAR 16.43 ▼ 1.79% ORANGE JUICE 138.55 ▼ 0.47% COTTON 85.03 ▲ 2.33% COCOA 5,719 ▲ 3.18% BEEF 223.60 ▼ 3.93% CATTLE 339.10 ▼ 3.16% LITHIUM 75.20 ▲ 1.47% PETR4 41.64 ▼ 0.05% VALE3 72.97 ▲ 0.83% ITUB4 38.60 ▼ 1.03% BBDC4 16.85 ▲ 0.36% ABEV3 14.89 ▼ 0.80% BBAS3 19.37 ▲ 0.47% B3SA3 14.26 ▼ 0.21% WEGE3 47.59 ▲ 0.49% PRIO3 59.14 ▼ 0.19% SUZB3 41.33 ▲ 2.35% RENT3 34.68 ▼ 0.09% AZZA3 15.89 ▼ 2.63% CSAN3 3.22 ▼ 1.83% RAIZ4 0.25 — 0.00% PCAR3 2.75 ▼ 0.36% GMAT3 3.65 ▼ 1.08% PSSA3 48.13 ▼ 0.54% CVCB3 1.33 ▼ 2.92% POSI3 3.36 ▲ 2.44% SLCE3 13.34 ▲ 0.30% NATU3 8.14 ▼ 0.73%
since 2009
Saturday, September 5, 2026

World-News North America

U.S. Services Sector Stalls While Manufacturing Shows Resilience in February

By · March 5, 2025 · 2 min read

Daily Brief

The morning intel from across Latin America. Free.

By subscribing you agree to our privacy policy. We never share your email.

The S&P Global February PMI data revealed a mixed economic picture for the United States, with the services sector contracting while manufacturing showed modest growth.

The Services PMI dropped to 49.7, its lowest level in over two years, from 52.9 in January, signaling contraction for the first time since late 2022. Meanwhile, the Manufacturing PMI rose slightly to 51.6, up from 51.2, indicating continued expansion in factory activity.

Chris Williamson, Chief Business Economist at S&P Global Market Intelligence, described the services sector’s performance as “worryingly weak.” He highlighted that optimism among businesses had plummeted due to political uncertainty, including federal spending cuts and tariffs.

This decline in confidence led to stagnating new orders and job cuts after months of hiring gains. The Composite PMI, which combines services and manufacturing data, fell to 50.4 in February from 52.7 in January.

This marks the slowest overall private-sector growth since late 2023. While manufacturing provided some support with its highest output growth in nearly a year, it was not enough to offset the drag from services.
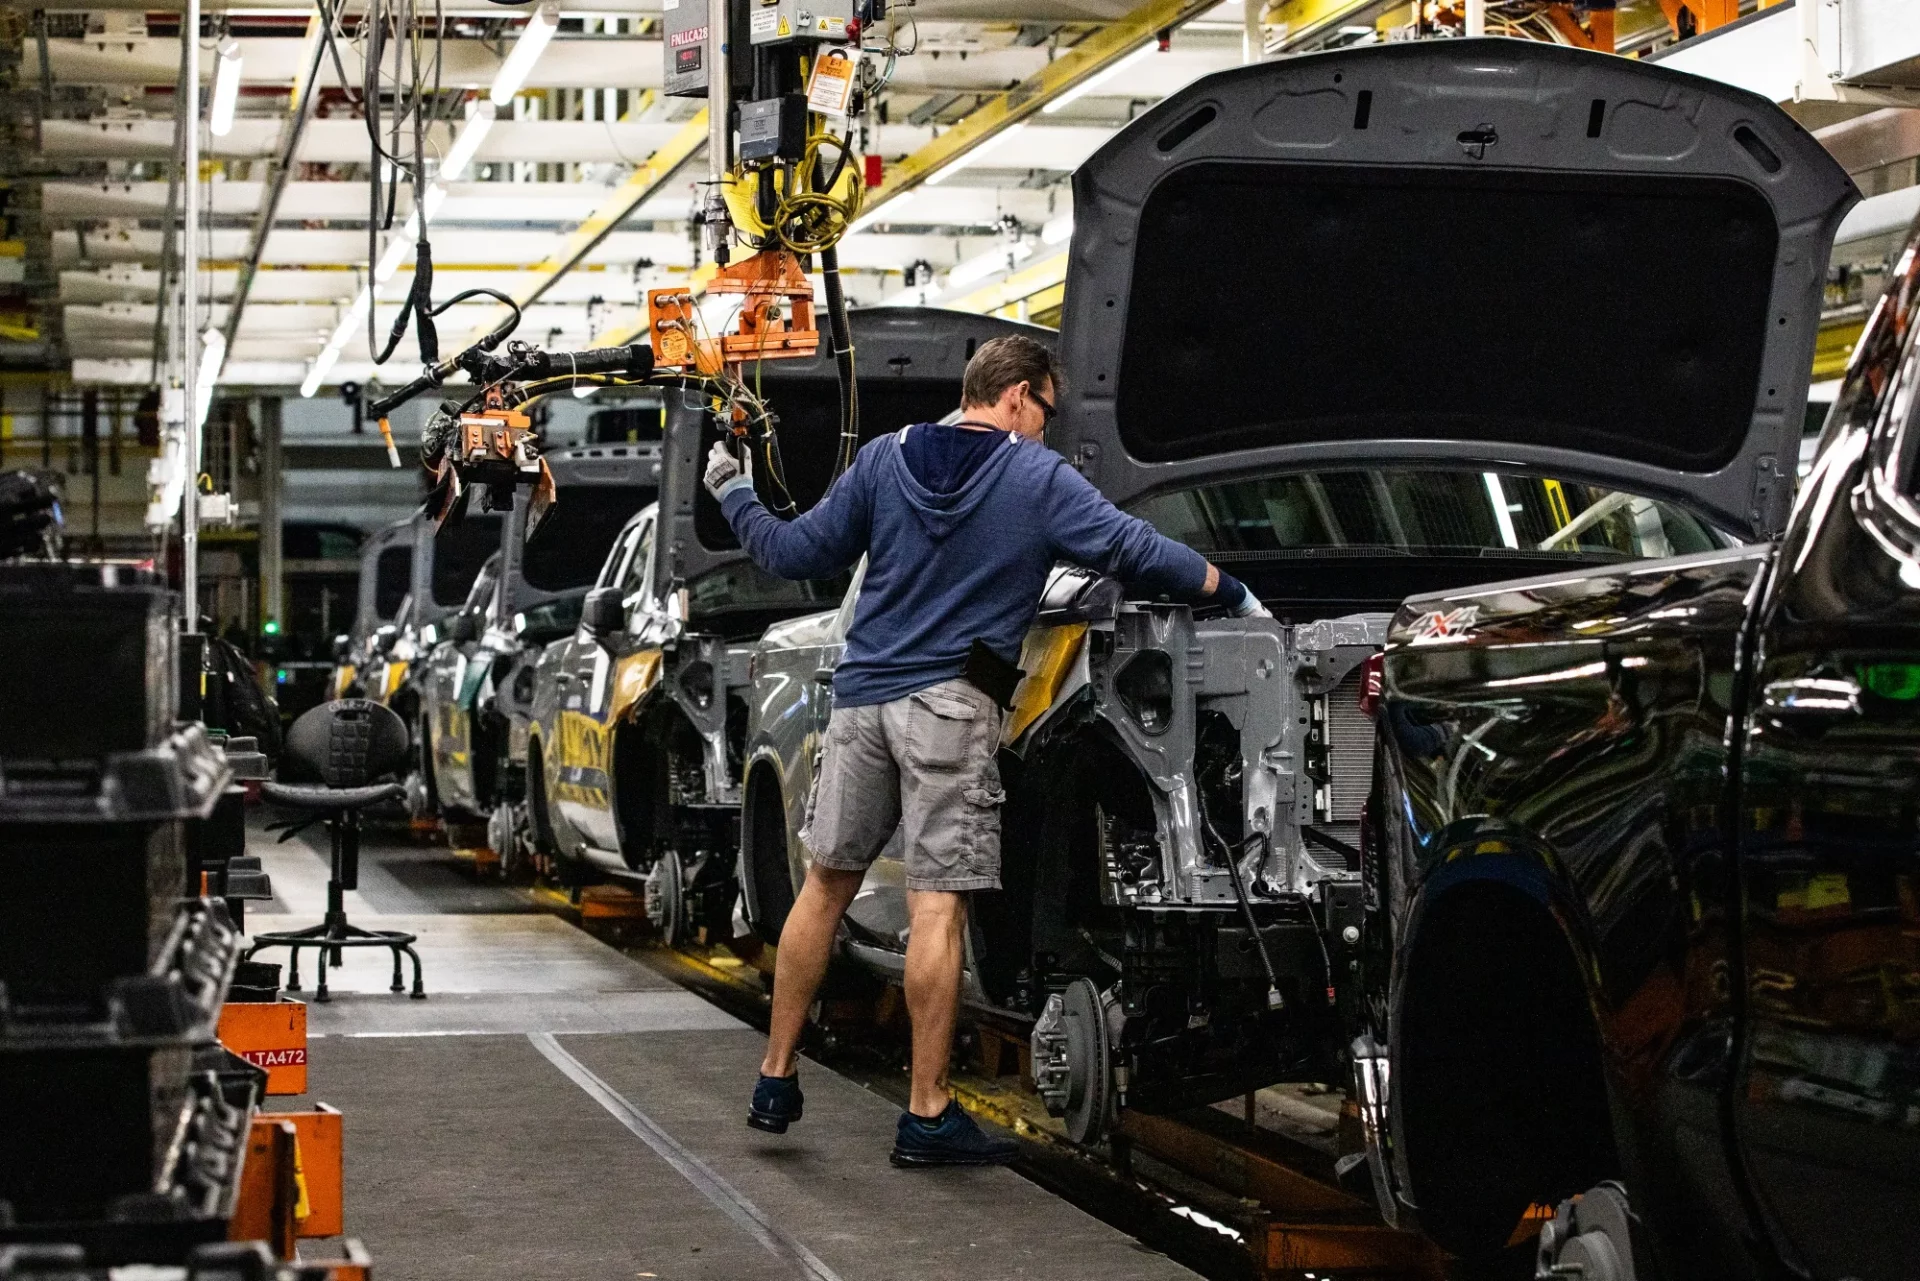
U.S. Services Sector Stalls While Manufacturing Shows Resilience in February
U.S. Services Sector Stalls While Manufacturing Shows Resilience in February.
One-stop reference
Company Intelligence
Every listed company in Latin America — financials, ownership and structure for 1,450+ companies across 26 exchanges, in one place.
Browse the directory →
RT
Ask Rio Times
17 years of Latin America reporting, on demand.
Open the full Ask Rio Times →

U.S. Economic Struggles

Input cost inflation surged across both sectors, driven by rising wages and tariffs. However, firms struggled to pass these costs onto customers due to weak demand, potentially squeezing profit margins further.

For example, input costs in manufacturing rose sharply, with the Prices Index reaching 62.4%, up from 54.9% in January. In manufacturing, the New Orders Index slipped back into contraction territory at 48.6 after three months of growth, reflecting cautious business sentiment.

Employment also weakened, with the Employment Index dropping to 47.6 from 50.3 in January. Despite these challenges, the manufacturing sector’s resilience stands out after enduring a prolonged downturn through most of 2024.

February marked its second consecutive month of expansion following a 26-month contraction streak. The PMI data underscores an economy grappling with uneven recovery and policy-driven uncertainty.

Businesses face rising costs and softening demand while navigating geopolitical pressures and federal policy changes. Analysts suggest that sustained weakness in services could dampen overall economic momentum unless demand rebounds or policy clarity improves.

As of now, the U.S. economy remains on fragile footing, with February’s PMI figures painting a cautious outlook for the months ahead.

This article was produced by The Rio Times’ automated newsroom system. How we use AI · Report an error

Read More from The Rio Times

The Rio Times · Power Map
See who really holds power in Latin America
Click to open the Power Map

Rotate for Best Experience

This report is optimized for landscape viewing. Rotate your phone for the full experience.