Lithium Miners Slide as Albemarle and SQM Drop on EV Demand Doubt
Key Facts
- Albemarle shares dropped 3.60% to US$110.91 on Friday, September 18, 2026, leading the lithium-miner board lower.
- SQM fell the most, losing 5.68% to US$67.72, the steepest move among the three lithium proxies tracked.
- The LIT lithium-miners ETF slipped 0.56% to US$70.50, a milder decline than the two biggest producer stocks.
- The move was driven by fresh doubt over EV-battery demand not by a sharp drop in lithium chemical prices themselves.
- Chile, Argentina and Bolivia form the Lithium Triangle the region that holds most of the world’s brine lithium reserves.
- SQM is Sociedad Química y Minera de Chile one of the main listed lithium names tied to the Lithium Triangle.
Today’s Focus
Lithium-miner equities fell on Friday, September 18, 2026, even as the raw material’s price steadied. Albemarle closed at US$110.91, down 3.60%, while Chile’s SQM dropped 5.68% to US$67.72.
The Global X Lithium & Battery Tech ETF, known as LIT, softened by just 0.56% to US$70.50. That smaller fall suggests the selling was concentrated in the big direct producers rather than across the whole battery supply chain.
The trigger was a shift in how investors are pricing future electric-vehicle battery demand. With no fresh lithium price crash, the fall signals that equity holders are demanding more evidence of a demand rebound before paying up for miner shares.
What matters today. For Latin America, the question is not today’s lithium price. It is whether EV sales can revive fast enough to justify the shares of Albemarle and SQM. Those two listed giants carry the most exposure to the Lithium Triangle.
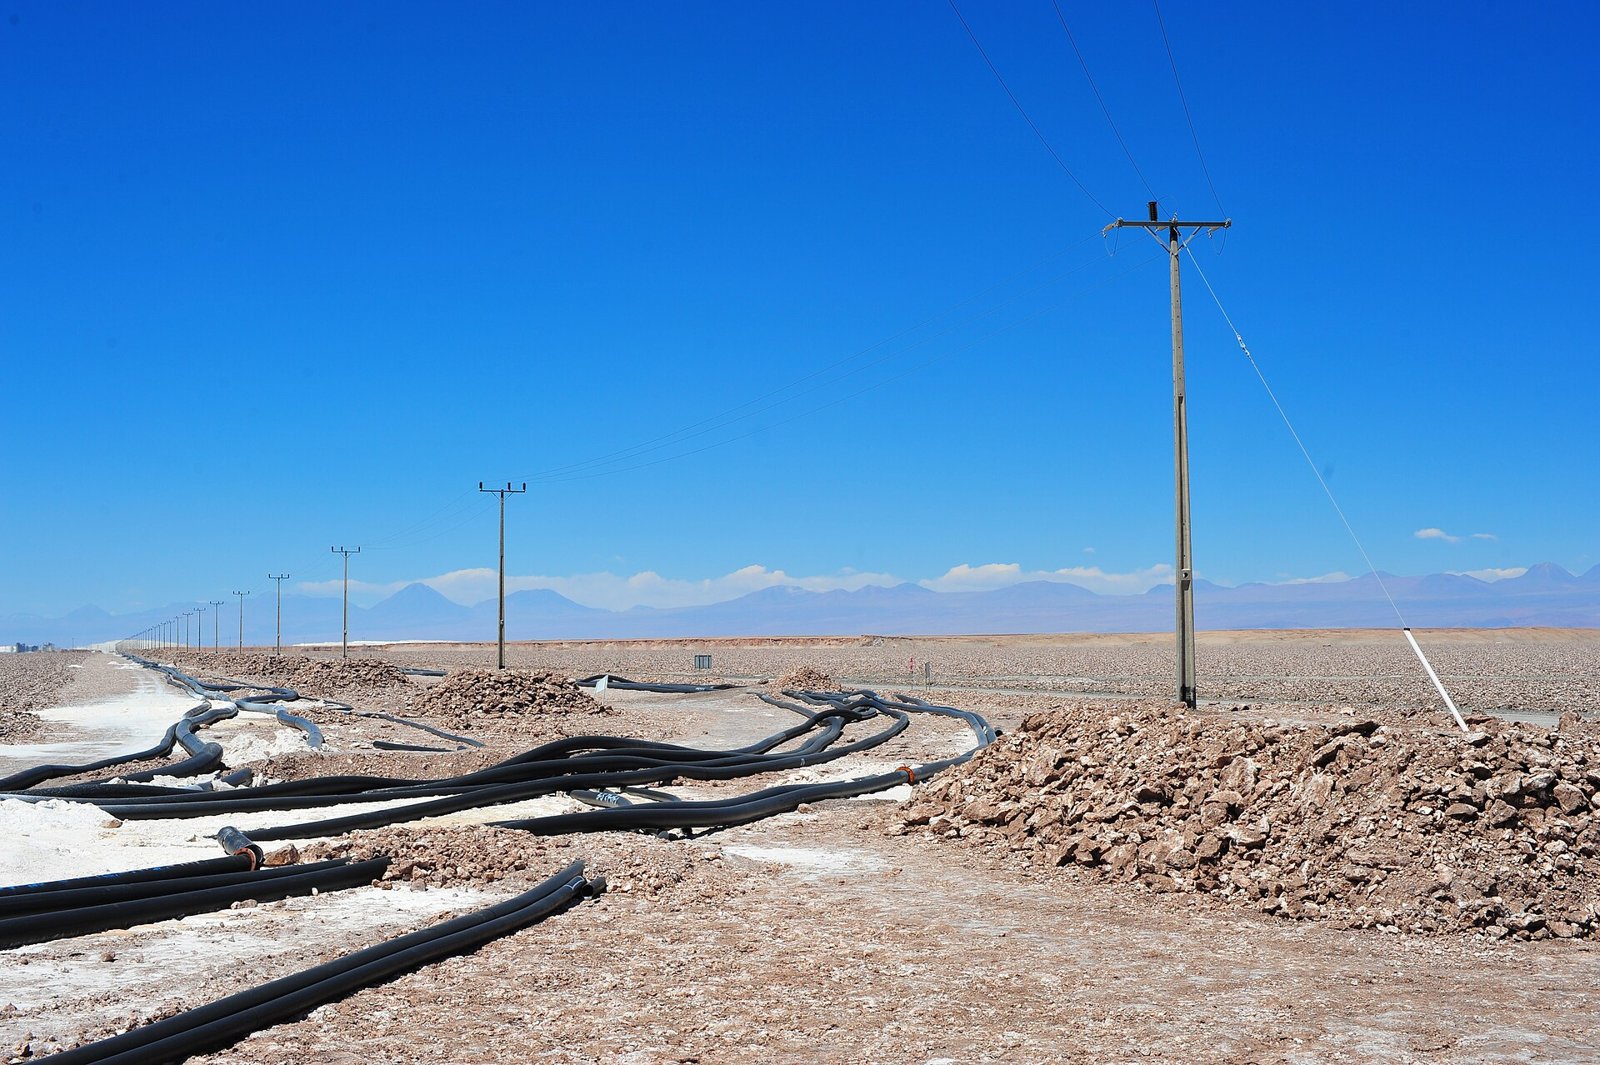
01 The session in one read
Lithium miner shares fell on Friday, September 18, 2026, led by the biggest Latin American name on the board. Chile’s SQM dropped 5.68% to US$67.72, the sharpest decline among the lithium proxies tracked.
US-listed Albemarle fell 3.60% to US$110.91. The broader LIT exchange-traded fund, which holds a basket of lithium and battery-technology stocks, slipped only 0.56% to US$70.50.
The session was a reminder that lithium equities do not always move with the raw material. They are claims on future profits, and Friday showed investors trimming those claims even without a fresh slump in lithium chemical prices.
The separation between a steadying commodity price and falling producer shares is the clearest warning from the session. Investors are no longer treating every stable lithium print as an automatic buy signal for miners; they want harder proof that electric-vehicle battery demand is genuinely turning. Watch next for any revision to EV sales guidance or battery-cell order books, especially in the Chinese and European markets that set the tone for Chile’s SQM and Albemarle’s Atacama operation.
02 The board
The three tracked proxies all closed lower, but the damage was uneven. LIT, the most diversified of the three and a fund rather than a single company, lost the least at 0.56%.
Albemarle, a major listed lithium producer with operations in Chile and elsewhere, fell more than six times as much as the ETF. SQM, for its part, fell hardest, a sign that investors treated the Chilean producer as the most exposed to the day’s shift in demand expectations.
| Asset | Level | Change |
|---|---|---|
| Lithium (LIT ETF) | US$70.50 | -0.56% |
| Albemarle | US$110.91 | -3.60% |
| SQM | US$67.72 | -5.68% |
Source: RT close, 2026-09-18. Where a commodity has no spot feed, an exchange-traded tracker or leading producer is shown as a labelled proxy.
Live Market IntelligenceThe live market board
Rio Times · Live Market Intelligence
Latin America — Cross-Market Board
-0.41%
185,229.17
-0.41%
63,375.93
-0.78%
11,381.18
+1.30%
3,021,926
-1.29%
2,548.22
+1.05%
60,023.65
-1.13%
| Instrument | Last | Change | YoY | Prev. | High | Low | Volume |
|---|---|---|---|---|---|---|---|
| IBOV | 185,229.17 | -0.41% | +21.85% | 185,992.03 | 168,310 | 167,142 | — |
| IPSA | 11,381.18 | +1.30% | — | 11,235.60 | 11,210 | 10,984 | 1,513,213,483 |
| IPC MEX | 63,375.93 | -0.78% | +12.17% | 63,873.32 | 66,121 | 65,405 | 108,886,187 |
| MERVAL | 3,021,926 | -1.29% | +30.51% | 3,022,485 | 3,042,365 | 2,991,150 | — |
| COLCAP | 2,548.22 | +1.05% | — | 9.04 | 9.05 | 9.02 | 4,133 |
| BVL PERÚ | 60,023.65 | -1.13% | — | — | — | — | — |
| USD/BRL | 5.16 | +0.01% | -5.13% | 5.16 | 5.18 | 5.14 | — |
| EUR/BRL | 5.95 | +1.01% | -5.83% | 5.89 | 5.98 | 5.94 | — |
| USD/MXN | 17.06 | -0.24% | -8.58% | 17.10 | 17.08 | 17.01 | — |
| USD/CLP | 913.98 | +0.04% | -5.67% | 913.65 | 915.11 | 906.68 | — |
| USD/COP | 3,140 | +0.03% | -22.04% | 3,139 | 3,141 | 3,105 | — |
| USD/PEN | 3.36 | -0.66% | -4.82% | 3.38 | 3.38 | 3.35 | — |
| USD/ARS | 1,493 | +0.10% | +12.96% | 1,491 | 1,494 | 1,480 | — |
| USD/UYU | 40.27 | +1.24% | +1.80% | 39.77 | 40.27 | 40.23 | — |
| USD/PYG | 5,939 | +1.68% | -19.54% | 5,841 | 5,939 | 5,925 | — |
| USD/BOB | 11.64 | -0.76% | +72.04% | 11.73 | 11.72 | 11.64 | — |
| USD/DOP | 58.34 | +1.25% | -3.44% | 57.62 | 58.34 | 58.04 | — |
| USD/CRC | 445.92 | +0.89% | -9.71% | 441.97 | 448.50 | 445.92 | — |
Live Company IntelligenceSociedad Quimica y Minera de Chile SA ADR B — the full investor dossier
Wall Street view
Valuation & profitability
Price & risk
$39.7952-wk high
$96.09
Revenue trend · 6y
Ownership
Dividend
03 What moved it
The move was led by doubts over electric-vehicle battery demand, the structural driver for lithium and lithium-miner equities, rather than by a fresh recovery or collapse in the metal itself. Lithium prices have been steadying after a long period of declines, yet that steadiness was not enough to hold miner shares up.
Traders appear to have demanded more than stabilisation. They wanted evidence that battery orders and EV sales are reaccelerating, and the absence of that evidence was enough to spark profit-taking in the two producer names.
Because LIT is an ETF that spreads its risk across many lithium and battery-related stocks, it cushioned the fall. Single-company shares have no such cushion, and that is why Albemarle and SQM absorbed the largest percentage losses.
04 The Latin American read
Chile, Argentina and Bolivia form the Lithium Triangle, the region holding most of the world’s brine lithium reserves. That geology makes Friday’s equity moves a direct concern for public finances, export earnings and mining jobs in all three countries.
Within that triangle, Chile has the deepest listed-market exposure because SQM, or Sociedad Química y Minera de Chile, is one of the main lithium names tied to the region. Albemarle also operates in Chile, so the 3.60% drop in its US shares is a signal being read from Santiago to Antofagasta.
For foreign investors, the session showed that owning Latin American lithium exposure through a single producer can be far more volatile than owning it through a diversified ETF. The region may supply the world’s brine, but its listed champions still swing on global EV sentiment.
05 The names to watch
SQM remains the purest Latin American lithium story on the board. Its 5.68% fall to US$67.72 makes it the most sensitive name to any further shift in battery-demand expectations.
Albemarle offers a broader chemicals business alongside lithium, yet its US$110.91 close and 3.60% drop show that investors still treat it as a lithium bellwether.
LIT, at US$70.50, is the calmer instrument for outsiders. By holding many battery-related stocks, it converts a sharp producer sell-off into a more moderate 0.56% decline.
06 The outlook
The immediate test is whether the demand doubts behind Friday’s selling persist into the new week. If lithium chemical prices hold steady while SQM and Albemarle keep falling, it will confirm that investors are pricing a delayed EV demand recovery.
The alternative is a rapid rebound in miner shares, which would suggest Friday was simply profit-taking after recent gains. For the Lithium Triangle, the difference matters enormously: one path points to cautious investment, the other to renewed risk appetite.
07 What to watch
- EV sales data: Evidence of stronger electric-vehicle sales is the clearest catalyst for Albemarle and SQM shares to recover.
- Lithium contract prices: Steady or rising lithium prices would help producer shares, but they must be sustained, not just a one-week pause in declines.
- Chilean market reaction: SQM is a major weighting in Chile’s equity index, so further falls would weigh on broader Chilean market sentiment.
- LIT vs producer divergence: A widening gap between the LIT ETF and single miner stocks would signal that risk is concentrated in direct lithium producers.
Frequently Asked Questions
What is the Lithium Triangle?
The Lithium Triangle is the region formed by Chile, Argentina and Bolivia, holding most of the world’s brine lithium reserves.
Why did lithium miner shares fall if lithium prices were steady?
Investors were no longer convinced that stable lithium prices alone guarantee strong future profits for miners; they wanted fresh evidence of growing EV battery demand.
Is LIT the spot lithium price?
No. LIT is an exchange-traded fund holding lithium and battery-related stocks, not a direct price for the lithium metal itself.
Which stock fell most on Friday, September 18, 2026?
SQM fell the most, dropping 5.68% to US$67.72, compared with Albemarle’s 3.60% decline and LIT’s 0.56% slip.
Market data: RT
This article was produced by The Rio Times’ automated newsroom system. How we use AI · Report an error
LatAm Markets: Live Signals → — real-time movers, turnover leaders and FX across Latin America.
Read More from The Rio Times