Key Facts
- Seaborne benchmark Seaborne iron ore hovered near US$95 a tonne in recent weeks, with the market in consolidation.
- Vale ADR Vale’s New York-listed shares closed at US$15.16, a decline of 1.11% against the previous session.
- China’s domestic contract The most-traded Dalian iron ore contract (I2701) closed at CNY 720 per tonne, up 0.49%, consolidating on a strong note.
- Furnaces steady An SMM survey put the blast-furnace operating rate at 89.13%, with daily hot metal output near 2.40 million tonnes.
- Imports still solid Chinese iron ore imports in January to July 2026 reached 736.84 million tonnes, up 5.9% versus the same period in 2025.
- July imports strong China imported 108.09 million tonnes in July, up 3.3% year-on-year and a fifth straight month above 100 million tonnes.
Today’s Focus
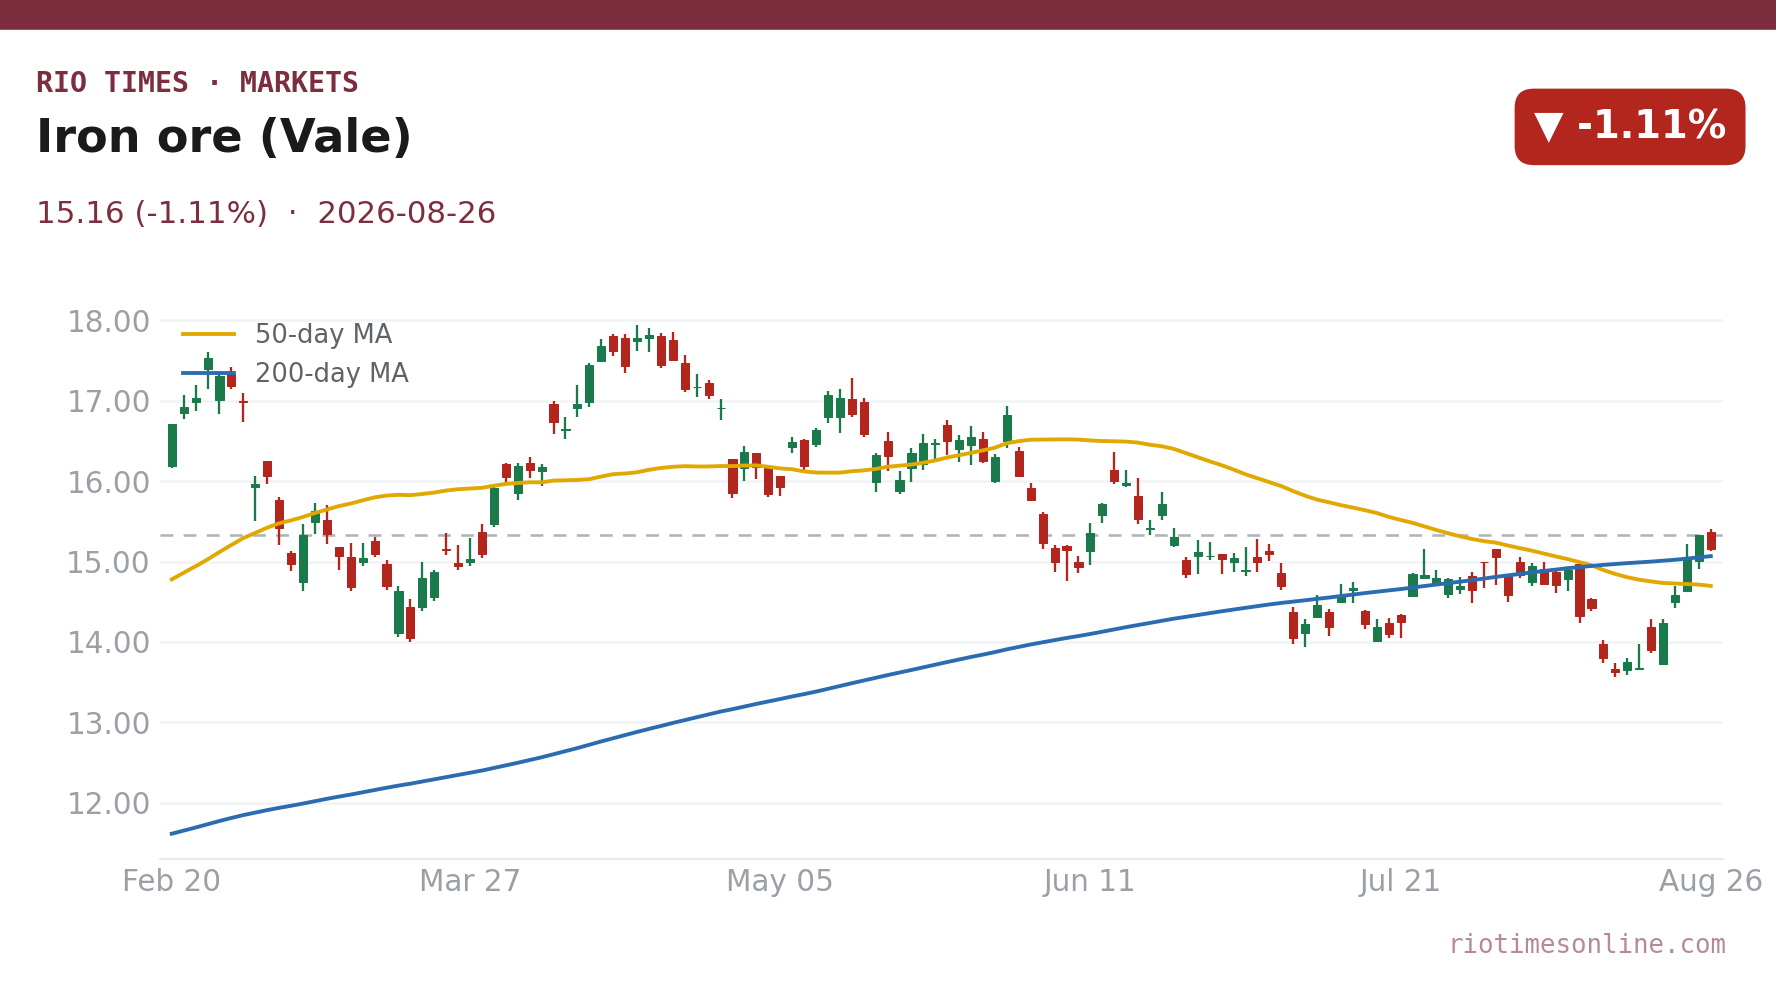
Iron ore’s global proxy board was mixed on Wednesday, August 26, 2026. Vale’s New York-listed ADR slipped 1.11% to US$15.16, while Rio Tinto fell 1.98% to US$104.70.
The commodity itself held steadier ground. China’s most-traded Dalian iron ore contract closed up 0.49% at CNY 720 per tonne, and seaborne prices hovered near US$95 a tonne.
This divergence reflects a market torn between firm physical imports and softer sentiment around miner shares. China still buys around 75% of the world’s seaborne iron ore, and import volumes remain strong.
The takeaway for investors is nuance: steel demand is not collapsing, but it is not accelerating either. Ore looks rangebound, not breaking out.
What matters today. China’s steel cycle remains robust enough to hold iron ore near recent levels, but not strong enough to lift miner share prices consistently.
01 The session in one read
Iron ore derivatives and producer shares told two slightly different stories on Wednesday, August 26, 2026. Chinese futures firmed while the biggest pure-play Latin American name, Vale, gave back ground in New York.
The most-traded Dalian contract closed up 0.49% at CNY 720 per tonne. Spot prices for mainstream ore varieties in China rose by CNY 2 to CNY 7 per tonne.
Vale’s American depositary receipts closed at US$15.16, down 1.11%. Rio Tinto’s US-listed shares fell 1.98% to US$104.70, a sign that caution was aimed at miners broadly rather than at the ore price itself.
Futures firmed while miner shares cooled, a gap that suggests investors are re-rating earnings expectations rather than the commodity. The variable to watch is whether China’s August steel output confirms the modest construction recovery; without it, ore could drift below the recent US$95 area.
02 The board
The price board highlights the gap between the commodity and the companies that dig it up. Vale’s New York shares fell 1.11% to US$15.16, while Rio Tinto dropped 1.98% to US$104.70.
The steadiness of the underlying contract stands in contrast to the choppy share moves. Traders in Dalian pushed the most-active January contract to CNY 720 per tonne, a firm close.
| Asset | Level | Change |
|---|---|---|
| Iron ore (Vale) | US$15.16 | -1.11% |
| Rio Tinto | US$104.70 | -1.98% |
Source: RT close, 2026-08-26. Where a commodity has no spot feed, an exchange-traded tracker or leading producer is shown as a labelled proxy.
Live Market IntelligenceThe live market board
Rio Times · Live Market Intelligence
Latin America — Cross-Market Board
| Instrument | Last | Change | YoY | Prev. | High | Low | Volume |
|---|---|---|---|---|---|---|---|
| IBOV | 206,887.52 | -1.04% | +21.85% | 209,066.90 | 168,310 | 167,142 | — |
| IPSA | 11,020.01 | -0.21% | — | 11,043.36 | 11,210 | 10,984 | 1,513,213,483 |
| IPC MEX | 67,147.36 | +0.60% | +12.17% | 66,746.78 | 66,121 | 65,405 | 108,886,187 |
| MERVAL | 2,869,151 | +1.45% | +30.51% | 3,022,485 | 3,042,365 | 2,991,150 | — |
| COLCAP | 2,570.34 | +1.55% | — | 9.04 | 9.05 | 9.02 | 4,133 |
| BVL PERÚ | 60,645.95 | -0.22% | — | — | — | — | — |
| USD/BRL | 5.16 | +0.01% | -5.13% | 5.16 | 5.18 | 5.14 | — |
| EUR/BRL | 5.95 | +1.01% | -5.83% | 5.89 | 5.98 | 5.94 | — |
| USD/MXN | 17.06 | -0.24% | -8.58% | 17.10 | 17.08 | 17.01 | — |
| USD/CLP | 913.98 | +0.04% | -5.67% | 913.65 | 915.11 | 906.68 | — |
| USD/COP | 3,140 | +0.03% | -22.04% | 3,139 | 3,141 | 3,105 | — |
| USD/PEN | 3.36 | -0.66% | -4.82% | 3.38 | 3.38 | 3.35 | — |
| USD/ARS | 1,493 | +0.10% | +12.96% | 1,491 | 1,494 | 1,480 | — |
| USD/UYU | 40.27 | +1.24% | +1.80% | 39.77 | 40.27 | 40.23 | — |
| USD/PYG | 5,939 | +1.68% | -19.54% | 5,841 | 5,939 | 5,925 | — |
| USD/BOB | 11.64 | -0.76% | +72.04% | 11.73 | 11.72 | 11.64 | — |
| USD/DOP | 58.34 | +1.25% | -3.44% | 57.62 | 58.34 | 58.04 | — |
| USD/CRC | 445.92 | +0.89% | -9.71% | 441.97 | 448.50 | 445.92 | — |
Live Company IntelligenceVale SA ADR — the full investor dossier
Wall Street view
Valuation & profitability
Price & risk
$10.1552-wk high
$17.44
Revenue trend · 6y
Ownership
Dividend
03 What moved it
The quiet strength in Chinese futures was underpinned by real cargoes. Spot prices for mainstream iron ore varieties in China rose by CNY 2 to CNY 7 per tonne, with traders maintaining steady shipments.
China’s import appetite remains the anchor for this market. The country bought 736.84 million tonnes of iron ore in the first seven months of 2026, up 5.9% from the same period in 2025.
July alone brought 108.09 million tonnes, up 3.3% year-on-year and a fifth straight month above 100 million tonnes. That suggests mills are still restocking even as steel prices stay subdued.
Yet construction steel remains soft. National rebar prices were assessed near CNY 3,219 per tonne in mid-August, holding a narrow range after two quiet weeks.
04 The Latin American read
For Latin American investors, Vale remains the key transmission mechanism from China’s steel cycle to regional markets. Its New York ADR is the most liquid vehicle for that exposure.
That matters for Brazil’s trade balance and for funds that use Vale as a proxy for China exposure. Firm Chinese futures alongside a soft Vale share price suggest investors are re-rating the shares rather than the commodity.
Rio Tinto’s 1.98% fall to US$104.70 confirms the cautious tone in international mining shares.
05 The names to watch
Vale is the giant of the trade, the world’s second-largest exporter of the commodity and the most important single name for Latin American portfolios. Its US share moves are followed by international funds and Brazilian domestic investors alike.
Rio Tinto, a global diversified miner, serves as a check on whether any move is Vale-specific or a broader shift in investor appetite for mining exposure. On this session, the US-listed shares fell 1.98%, which frames the weakness as global rather than Brazilian.
06 The outlook
The iron ore market is not flashing danger and is not breaking upward. It is waiting for clearer evidence that China’s steel demand can move beyond the muted recovery now expected in the August construction season.
The import numbers argue against a sharp downside; the soft rebar price argues against a sharp upside. That stalemate favors rangebound trading near recent levels unless Chinese mill margins deteriorate further.
07 What to watch
- China’s August steel output: Industry data will confirm whether the modest construction recovery is translating into actual crude steel production, the direct driver of ore demand.
- Vale’s share premium: A continued divergence between stable ore futures and a slipping ADR could signal that investors expect weaker Chinese mill margins to squeeze miner earnings.
- Seaborne spot trades: Any change in premium for mid-grade 62% Fe cargoes will show whether Chinese mills are restocking aggressively or merely replacing depleted inventories.
- Brazilian export volumes: Weekly shipping data will reveal whether Latin American supply is increasing into an already well-fed Chinese market, which would cap a rebound in the benchmark.
Frequently Asked Questions
Why did Vale’s shares fall while iron ore futures rose?
Investors often re-rate mining shares based on future earnings expectations, not today’s spot commodity price. Chinese steel margins remain subdued, which can weigh on miner shares even when the commodity itself firms.
Is China’s iron ore demand still growing?
Yes, modestly. Imports in January to July 2026 were up 5.9% year-on-year, and July’s 108.09 million tonnes marked a fifth straight month above 100 million tonnes.
What is the main driver for the iron ore price?
China’s steel cycle. The country buys roughly 75% of all seaborne iron ore, so its construction and manufacturing activity sets the global price tone.
Where is the iron ore price likely to head next?
Seaborne prices have hovered near US$95 a tonne in recent weeks. Without a decisive change in Chinese steel output, that consolidation is likely to continue.
Market data: RT
This article was produced by The Rio Times’ automated newsroom system. How we use AI · Report an error · Editorial responsibility: Matthias Camenzind, Editor-in-Chief
LatAm Markets: Live Signals → — real-time movers, turnover leaders and FX across Latin America.