IBOV 186,595.60 ▲ 0.74% IPSA 11,357.82 ▼ 0.21% IPC MEX 63,536.96 ▲ 0.25% MERVAL 2,998,956 — 0.00% COLCAP 2,565.55 ▲ 0.68% BVL PERÚ 59,344.04 ▲ 0.31% USD/BRL5.12▲ 0.13% USD/MXN17.24▲ 0.13% USD/CLP943.70▼ 0.58% USD/COP3,206▲ 0.94% USD/PEN3.38▲ 0.02% USD/ARS1,514▼ 0.02% USD/UYU40.06▲ 2.88% USD/PYG5,918▲ 3.14% USD/BOB11.85▲ 25.24% USD/DOP59.17▲ 3.53% USD/CRC445.27▲ 2.84% USD/GTQ7.63▲ 3.24% USD/HNL26.86▲ 3.32% USD/NIO36.62▲ 2.80% USD/VES850.29▼ 0.13% USD/PAB1.00— 0.00% USD/BZD2.00— 0.00% USD/JMD 157.28 — 0.00% USD/TTD6.74▲ 2.48% EUR/BRL5.86▼ 0.55% BRENT 88.88 ▼ 0.03% WTI 83.11 ▼ 0.11% IRON ORE 161.91 — — COPPER 6.61 ▲ 0.03% GOLD 4,461 ▲ 1.78% SILVER 65.59 ▲ 1.26% SOY 1,184 ▲ 3.20% CORN 480.50 ▲ 10.02% WHEAT 655.00 ▲ 3.93% COFFEE 317.25 ▼ 5.51% SUGAR 16.43 ▼ 1.79% ORANGE JUICE 138.55 ▼ 0.47% COTTON 85.03 ▲ 2.33% COCOA 5,719 ▲ 3.18% BEEF 223.60 ▼ 3.93% CATTLE 339.10 ▼ 3.16% LITHIUM 75.20 ▲ 1.47% PETR4 41.64 ▼ 0.05% VALE3 72.97 ▲ 0.83% ITUB4 38.60 ▼ 1.03% BBDC4 16.85 ▲ 0.36% ABEV3 14.89 ▼ 0.80% BBAS3 19.37 ▲ 0.47% B3SA3 14.26 ▼ 0.21% WEGE3 47.59 ▲ 0.49% PRIO3 59.14 ▼ 0.19% SUZB3 41.33 ▲ 2.35% RENT3 34.68 ▼ 0.09% AZZA3 15.89 ▼ 2.63% CSAN3 3.22 ▼ 1.83% RAIZ4 0.25 — 0.00% PCAR3 2.75 ▼ 0.36% GMAT3 3.65 ▼ 1.08% PSSA3 48.13 ▼ 0.54% CVCB3 1.33 ▼ 2.92% POSI3 3.36 ▲ 2.44% SLCE3 13.34 ▲ 0.30% NATU3 8.14 ▼ 0.73% IBOV 186,595.60 ▲ 0.74% IPSA 11,357.82 ▼ 0.21% IPC MEX 63,536.96 ▲ 0.25% MERVAL 2,998,956 — 0.00% COLCAP 2,565.55 ▲ 0.68% BVL PERÚ 59,344.04 ▲ 0.31% USD/BRL 5.16 ▲ 0.01% USD/MXN 17.06 ▼ 0.24% USD/CLP 913.98 ▲ 0.04% USD/COP 3,140 ▲ 0.03% USD/PEN 3.36 ▼ 0.66% USD/ARS 1,493 ▲ 0.10% USD/UYU 40.27 ▲ 1.24% USD/PYG 5,939 ▲ 1.68% USD/BOB 11.64 ▼ 0.76% USD/DOP 58.34 ▲ 1.25% USD/CRC 445.92 ▲ 0.89% USD/GTQ 7.62 ▲ 2.21% USD/HNL 26.79 ▲ 1.57% USD/NIO 36.62 ▲ 0.69% USD/VES 762.44 ▼ 0.13% USD/PAB 1.00 — 0.00% USD/BZD 2.00 — 0.00% USD/JMD 157.28 — 0.00% USD/TTD 6.70 ▲ 0.61% EUR/BRL 5.95 ▲ 1.01% BRENT 88.88 ▼ 0.03% WTI 83.11 ▼ 0.11% IRON ORE 161.91 — — COPPER 6.61 ▲ 0.03% GOLD 4,461 ▲ 1.78% SILVER 65.59 ▲ 1.26% SOY 1,184 ▲ 3.20% CORN 480.50 ▲ 10.02% WHEAT 655.00 ▲ 3.93% COFFEE 317.25 ▼ 5.51% SUGAR 16.43 ▼ 1.79% ORANGE JUICE 138.55 ▼ 0.47% COTTON 85.03 ▲ 2.33% COCOA 5,719 ▲ 3.18% BEEF 223.60 ▼ 3.93% CATTLE 339.10 ▼ 3.16% LITHIUM 75.20 ▲ 1.47% PETR4 41.64 ▼ 0.05% VALE3 72.97 ▲ 0.83% ITUB4 38.60 ▼ 1.03% BBDC4 16.85 ▲ 0.36% ABEV3 14.89 ▼ 0.80% BBAS3 19.37 ▲ 0.47% B3SA3 14.26 ▼ 0.21% WEGE3 47.59 ▲ 0.49% PRIO3 59.14 ▼ 0.19% SUZB3 41.33 ▲ 2.35% RENT3 34.68 ▼ 0.09% AZZA3 15.89 ▼ 2.63% CSAN3 3.22 ▼ 1.83% RAIZ4 0.25 — 0.00% PCAR3 2.75 ▼ 0.36% GMAT3 3.65 ▼ 1.08% PSSA3 48.13 ▼ 0.54% CVCB3 1.33 ▼ 2.92% POSI3 3.36 ▲ 2.44% SLCE3 13.34 ▲ 0.30% NATU3 8.14 ▼ 0.73%
since 2009
Tuesday, September 22, 2026

Historic $137.8 Billion: Mexico Dominates U.S. Automotive Trade in 2024

By · February 17, 2025 · 2 min read

The LatAm Brief

One email, every weekday morning. What moved in Latin American markets, politics and expat life.

Yesterday’s subject line: “68 strikes, 223 people. A UN expert says murder.”

Free. We send a confirmation link first — nothing arrives until you click it. Unsubscribe with one click in any edition. If you stop opening us for 30 days we stop sending by ourselves, as we assume the interest is no longer there. See our privacy policy. We never share your email.

Mexico’s automotive trade surplus with the United States hit a record $137.8 billion in 2024, a 6% increase from 2023, according to U.S. Department of Commerce data.

Mexican automotive exports rose 4.9% to $181.4 billion, while U.S. exports to Mexico grew 1.5%, reaching $43.6 billion. This milestone underscores Mexico’s critical role in the U.S. automotive supply chain, where shared production deeply integrates both economies.

On average, 40% of Mexican-manufactured goods include U.S.-made components, compared to 25% for Canadian products. Despite this integration, Mexico remains the country with which the U.S. has its largest automotive trade deficit.

Over the last decade, this surplus more than doubled, rising from $63.5 billion in 2014 to its current level. In contrast, the U.S. achieved a $7.1 billion automotive trade surplus with Canada in 2024, supported by $63.8 billion in exports and $56.7 billion in imports.

Amid these developments, President Donald Trump has reignited trade tensions by suggesting tariffs on automotive imports from Mexico and Canada starting April 2, pending policy recommendations from his administration.
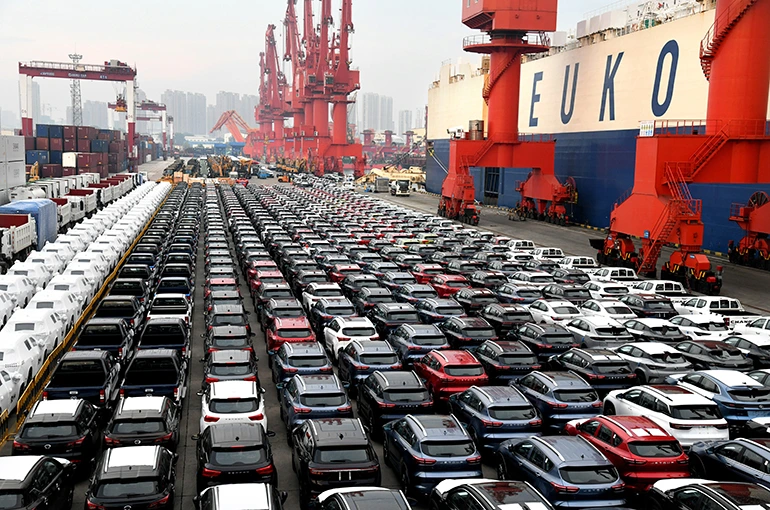
Historic $137.8 Billion: Mexico Dominates U.S. Automotive Trade in 2024
Historic $137.8 Billion: Mexico Dominates U.S. Automotive Trade in 2024.
One-stop reference
Company Intelligence
Every listed company in Latin America — financials, ownership and structure for 1,450+ companies across 26 exchanges, in one place.
Browse the directory →
RT
Ask Rio Times
17 years of Latin America reporting, on demand.
Open the full Ask Rio Times →

US Tariff Threats and Their Impact

Trump’s tariff threats align with his broader strategy of using trade measures to push for concessions on issues such as immigration and drug trafficking. Automakers are already preparing for potential disruptions.

General Motors CEO Mary Barra noted the company could shift some production back to the U.S., while Nissan CEO Makoto Uchida suggested relocating production if tariffs rise significantly. Ford and Stellantis have also explored contingency plans to minimize supply chain impacts.

Industry leaders continue advocating for free trade under USMCA rules. They emphasize the importance of North American supply chain integration for competitiveness.

As policy uncertainty looms, Mexico’s growing trade surplus highlights its pivotal role in the region’s automotive market. It also underscores its potential vulnerability to shifting U.S. trade policies.

Key Facts

Deep Dive

For the complete picture, read our in-depth guide: Mexico Economy 2026: GDP, Peso, Nearshoring, Banxico and Trade

This article was produced by The Rio Times’ automated newsroom system. How we use AI · Report an error

Read More from The Rio Times

The Rio Times · Power Map
See who really holds power in Latin America
Click to open the Power Map

Rotate for Best Experience

This report is optimized for landscape viewing. Rotate your phone for the full experience.