Guyana Region Two Claims a Boom, With Projects Not Percentages
GUYANA · ECONOMY
Key Facts
- —The claim Region Two chairman Devin Mohan says the region is experiencing a record-breaking economic boom.
- —Where he said it At the Essequibo Chamber of Commerce and Industry’s twentieth annual Agro Trade Fair.
- —The catch He gave no growth percentages or dollar figures. The claim rests on a list of projects.
- —The power numbers Hinterland generation capacity has risen from 1.62 MW to almost 17.5 MW over five years.
- —The spending The government says G$41.7 billion went into hinterland development across the same period.
- —Who says so The electricity and spending figures come from President Irfaan Ali, without independent audit.
The Guyana Region Two claim is a political speech, not a statistic. The hinterland electricity numbers behind it are a lot more specific.
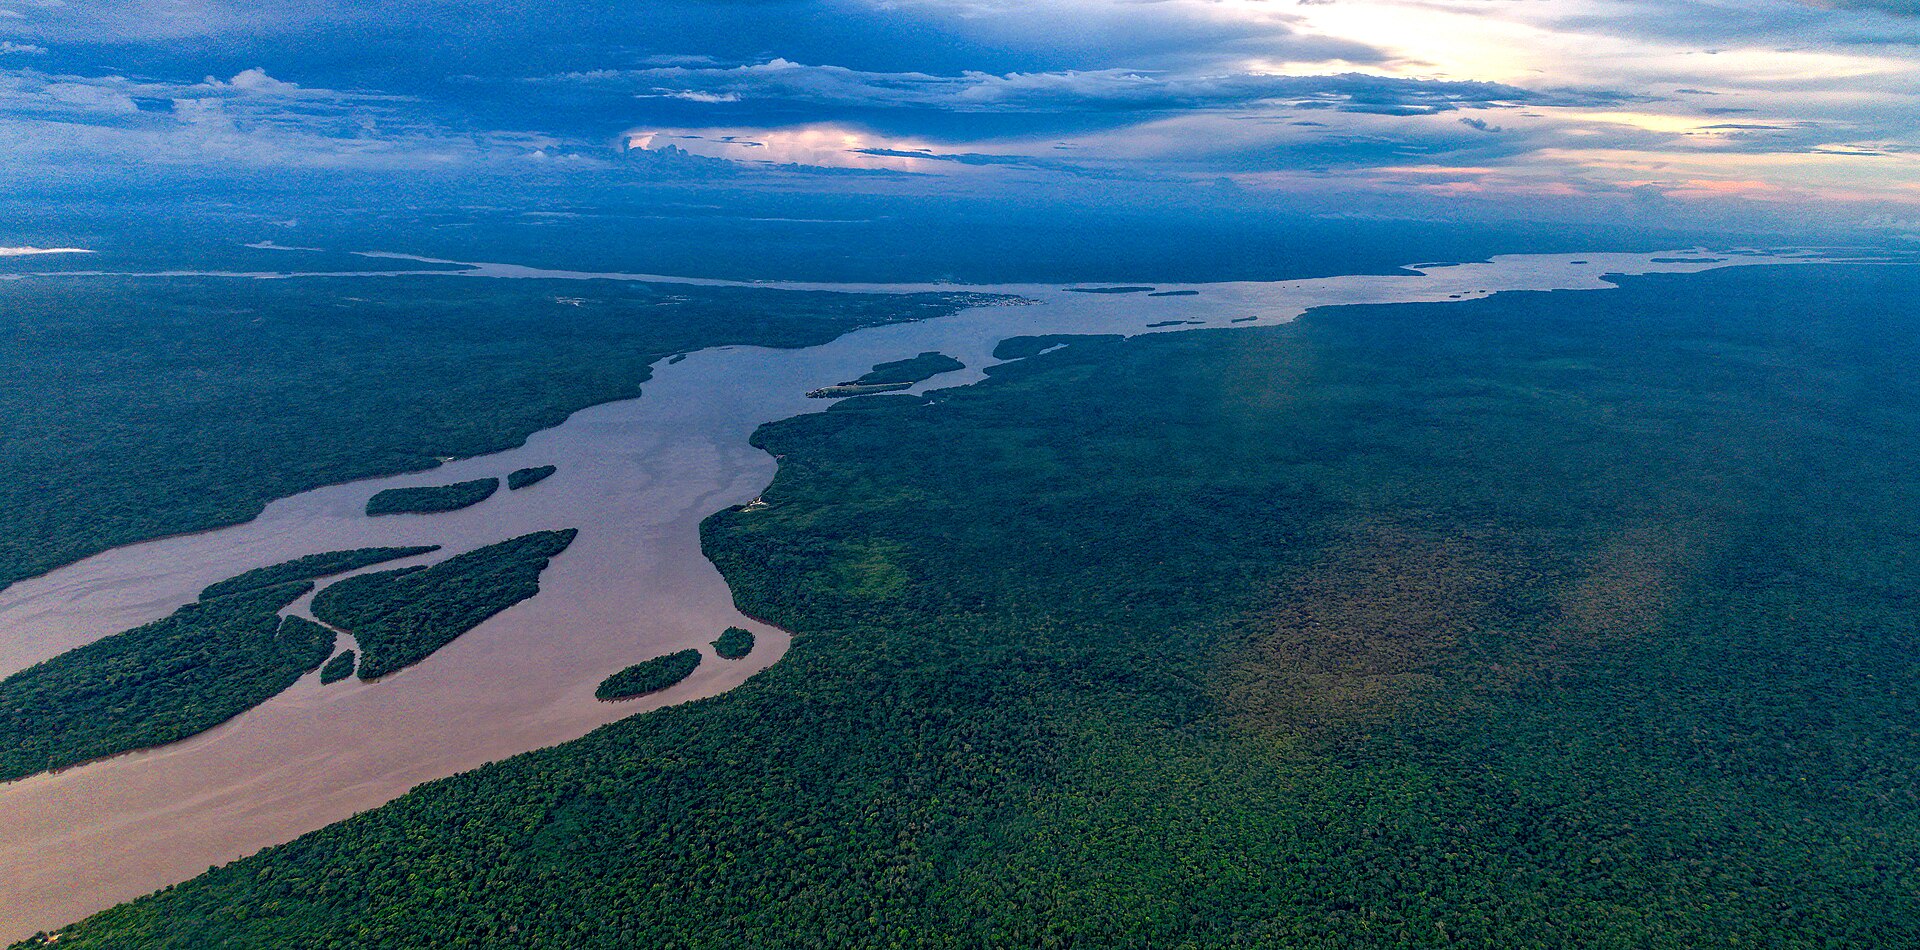
The chairman of Guyana Region Two says his region is in a record-breaking economic boom. Devin Mohan made the claim at an agricultural trade fair on the Essequibo coast.
The occasion was the Essequibo Chamber of Commerce and Industry’s twentieth annual Agro Trade Fair. The Guyana Chronicle reported the address on 7 September.
Mohan said the region had moved from an era of stagnation into a dynamic, modern economic corridor. He credited President Irfaan Ali.
What he did not give was a number. There were no growth percentages and no regional output figures in the reported speech.
What Guyana Region Two Is Actually Claiming
The claim rests on a list of projects rather than on economic statistics. That is a normal shape for a regional political speech.
The projects named include the Lima Regional Hospital and the Anna Regina National Stadium. New housing schemes and road upgrades were also cited.
A solar farm and a rehabilitated airstrip complete the list. The Anna Regina airstrip, worth G$221 million, was commissioned on 4 July 2026.
Sectors named were agriculture, aquaculture, commerce, green energy and construction. None came with a figure attached.
The Numbers That Do Exist
National hinterland electricity figures are more specific. Generation capacity has risen from 1.62 MW to almost 17.5 MW over five years.
That is roughly a tenfold increase, delivered through hydropower, solar farms and household solar systems. President Ali attributed the programme to Prime Minister Mark Phillips.
Over G$11 billion has gone into energy in indigenous villages. Fifty-six solar mini-grids are slated for completion in hinterland communities by year end.
Total hinterland and Amerindian spending is put at G$41.7 billion over five years. That includes G$21.7 billion through the Amerindian Development Fund and G$14.2 billion in low-carbon strategy funds.
Where the Figures Come From
All of these numbers are government figures, asserted by the president at Amerindian Heritage Month events. We found no independent audit of them.
That does not make them wrong. It does mean they are claims by the body that spent the money.
Guyana’s oil revenues have made this scale of regional spending possible for the first time. The scrutiny infrastructure has not grown at the same speed.
Why Region Two Matters
Region Two is Pomeroon-Supenaam, on the western coast between the Essequibo and Pomeroon rivers. It is agricultural rather than petroleum territory.
Rice and coconut dominate its economy. Oil is offshore and well to the east.
That makes it a test of whether oil money reaches regions that do not produce oil. A boom claim there is a claim about distribution.
What to Watch
The first marker is regional statistics. A boom that cannot be measured is a project list with adjectives.
The second is the fifty-six mini-grids by year end. That is a specific, checkable commitment with a date.
The third is whether the hinterland capacity figure holds. A tenfold rise from a very low base is easier to achieve than to sustain.
More: Latin America news in English, every day from The Rio Times.
Frequently Asked Questions
What did the Region Two chairman say?
Devin Mohan said Region Two is experiencing a record-breaking economic boom, speaking at the Essequibo Chamber of Commerce and Industry’s twentieth Agro Trade Fair. He cited projects rather than growth figures.
What are the hinterland power figures?
Generation capacity has risen from 1.62 MW to almost 17.5 MW over five years, with over G$11 billion invested in energy in indigenous villages and fifty-six solar mini-grids due by year end.
Are these figures independently verified?
No. They are government figures asserted by President Irfaan Ali at Amerindian Heritage Month events. We found no independent audit of them.
Sources: Guyana Chronicle, Kaieteur News, INews Guyana, Rio Times.
This article was produced by The Rio Times’ automated newsroom system. How we use AI · Report an error
Read More from The Rio Times