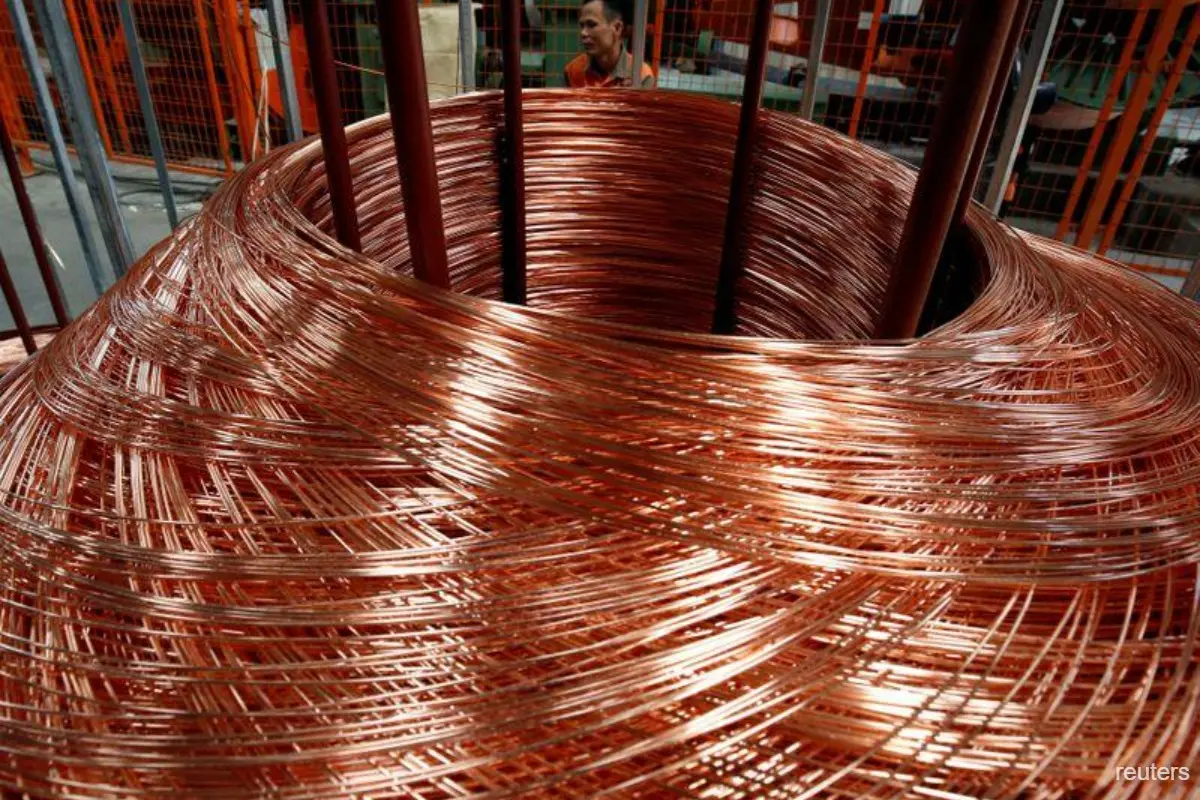
Copper prices surged to record levels in the past 24 hours, driven by official confirmation of a 50% tariff on U.S. copper imports. Data from July 10, 2025, show U.S. copper futures trading between $5.58 and $5.63 per pound, a 13% jump from the previous session.
The London Metal Exchange (LME) saw a marginal increase, with prices at $9,635 per ton. This sharp divergence highlights the immediate impact of U.S. policy on global copper flows.
The U.S. government announced the tariff as a national security measure, citing copper’s strategic role in defense and technology. This move triggered a rush of buying on U.S. exchanges, with volumes spiking as traders scrambled to secure supply ahead of the August 1 implementation.
U.S. copper now trades at a 25% premium over global benchmarks, a gap not seen in decades. Global copper supply remains tight. The International Copper Study Group projects a 289,000-ton global deficit for 2025, more than double last year’s shortfall.
U.S. imports reached 881,000 tons year-to-date, underscoring the country’s dependence on foreign copper. Inventories on the LME rose to 107,125 tons, while COMEX stocks reached 201,203 metric tons, reflecting pre-tariff stockpiling.

ETF flows confirm heightened speculative and hedging activity. The United States Copper Index Fund gained 12% on the tariff news, with a 35% increase year-to-date.
The Global X Copper Miners ETF also saw inflows, though gains were more muted due to lower U.S. exposure. No significant outflows have been reported, indicating that investors expect continued volatility.
Copper Surges Amid Strong Demand and Supply Constraints
Technical analysis of the daily chart shows copper in a strong uptrend. The price broke above all major moving averages, with the 50-day and 200-day lines now well below current levels.
The Relative Strength Index (RSI) stands above 75, signaling overbought conditions and the potential for a short-term pullback. The Moving Average Convergence Divergence (MACD) indicator displays a strong bullish crossover, with momentum accelerating.
Bollinger Bands show prices riding the upper band, reflecting increased volatility. On the four-hour chart, the rally remains steep, with consolidation above $5.60.
The MACD remains bullish, but the histogram hints at early signs of momentum waning. The RSI on this timeframe also indicates overbought territory, while volume has tapered after the initial surge.
Market participants now face a new landscape. The tariff has driven a wedge between U.S. and global copper prices. Supply constraints, robust demand from China and the U.S., and speculative flows all support elevated prices.
However, technical indicators warn that the market is stretched. Any change in fundamentals or policy could trigger sharp reversals. The next few weeks will test the resilience of this rally as the market adapts to the new trade regime.
Live Market IntelligenceCommodities — Live Market Board
Rio Times · Live Market Intelligence
Commodities — Live Market Board
-0.03%
| Instrument | Last | Change | YoY | Prev. | High | Low | Volume |
|---|---|---|---|---|---|---|---|
| GOLD | 4,461 | +1.78% | +33.20% | 4,383 | 4,503 | 4,421 | 139,824 |
| SILVER | 65.59 | +1.26% | +73.05% | 64.77 | 66.98 | 64.81 | 46,406 |
| BRENT | 88.88 | -0.03% | +34.42% | 88.91 | 90.07 | 88.12 | 29,713 |
| WTI | 83.11 | -0.11% | +31.57% | 83.20 | 84.35 | 82.40 | 166,848 |
| COPPER | 6.61 | +0.03% | +46.70% | 6.61 | 6.71 | 6.61 | 39,543 |
| LITHIUM | 75.20 | +1.47% | +62.95% | 74.11 | 75.80 | 75.08 | 89,275 |
| IRON ORE | 161.91 | — | +58.10% | 161.91 | 161.91 | 1 | |
| SOY | 1,184 | +3.20% | +17.05% | 1,148 | 1,199 | 1,168 | 163,179 |
| CORN | 480.50 | +10.02% | +29.34% | 436.75 | 480.75 | 459.50 | 341,248 |
| WHEAT | 655.00 | +3.93% | +29.70% | 630.25 | 657.75 | 631.50 | 128,793 |
| COFFEE | 317.25 | -5.51% | +0.67% | 335.75 | 321.20 | 313.55 | 21,747 |
| SUGAR | 16.43 | -1.79% | -3.01% | 16.73 | 17.11 | 16.22 | 171,992 |
| COCOA | 5,719 | +3.18% | -34.96% | 5,543 | 5,779 | 5,574 | 26,773 |
| ORANGE JUICE | 138.55 | -0.47% | -45.38% | 139.20 | 141.05 | 137.50 | 703 |
| COTTON | 85.03 | +2.33% | +26.78% | 83.09 | 82.90 | 81.96 | 16,546 |
| BEEF | 223.60 | -3.93% | -5.18% | 232.75 | 226.40 | 223.00 | 16,126 |
| CATTLE | 339.10 | -3.16% | -1.82% | 350.17 | 345.50 | 338.60 | 10,164 |
| USD/BRL | 5.16 | +0.01% | -5.13% | 5.16 | 5.18 | 5.14 | — |
This article was produced by The Rio Times’ automated newsroom system. How we use AI · Report an error · Editorial responsibility: Matthias Camenzind, Editor-in-Chief
LatAm Markets: Live Signals → — real-time movers, turnover leaders and FX across Latin America.