IBOV 183,476.86 ▼ 0.27% IPSA 11,255.90 ▼ 0.39% IPC MEX 64,992.23 ▲ 1.13% MERVAL 2,893,751 ▼ 1.57% COLCAP 2,584.72 ▼ 0.95% BVL PERÚ 59,934.37 ▲ 1.27% USD/BRL5.19▼ 0.12% USD/MXN17.68▼ 0.27% USD/CLP960.63▼ 0.27% USD/COP3,293▲ 0.20% USD/PEN3.39▼ 0.67% USD/ARS1,525▲ 0.30% USD/UYU40.21▲ 3.50% USD/PYG5,870▲ 2.23% USD/BOB12.17▲ 2.05% USD/DOP59.35▲ 0.25% USD/CRC450.87▲ 2.53% USD/GTQ7.64▲ 3.22% USD/HNL26.85▲ 0.31% USD/NIO36.62▲ 2.66% USD/VES853.52▼ 0.13% USD/PAB1.00— 0.00% USD/BZD2.00— 0.00% USD/JMD 157.28 — 0.00% USD/TTD6.77▲ 2.72% EUR/BRL5.91▲ 0.63% BRENT 88.88 ▼ 0.03% WTI 83.11 ▼ 0.11% IRON ORE 161.91 — — COPPER 6.61 ▲ 0.03% GOLD 4,461 ▲ 1.78% SILVER 65.59 ▲ 1.26% SOY 1,184 ▲ 3.20% CORN 480.50 ▲ 10.02% WHEAT 655.00 ▲ 3.93% COFFEE 317.25 ▼ 5.51% SUGAR 16.43 ▼ 1.79% ORANGE JUICE 138.55 ▼ 0.47% COTTON 85.03 ▲ 2.33% COCOA 5,719 ▲ 3.18% BEEF 223.60 ▼ 3.93% CATTLE 339.10 ▼ 3.16% LITHIUM 75.20 ▲ 1.47% PETR4 41.64 ▼ 0.05% VALE3 72.97 ▲ 0.83% ITUB4 38.60 ▼ 1.03% BBDC4 16.85 ▲ 0.36% ABEV3 14.89 ▼ 0.80% BBAS3 19.37 ▲ 0.47% B3SA3 14.26 ▼ 0.21% WEGE3 47.59 ▲ 0.49% PRIO3 59.14 ▼ 0.19% SUZB3 41.33 ▲ 2.35% RENT3 34.68 ▼ 0.09% AZZA3 15.89 ▼ 2.63% CSAN3 3.22 ▼ 1.83% RAIZ4 0.25 — 0.00% PCAR3 2.75 ▼ 0.36% GMAT3 3.65 ▼ 1.08% PSSA3 48.13 ▼ 0.54% CVCB3 1.33 ▼ 2.92% POSI3 3.36 ▲ 2.44% SLCE3 13.34 ▲ 0.30% NATU3 8.14 ▼ 0.73% IBOV 183,476.86 ▼ 0.27% IPSA 11,255.90 ▼ 0.39% IPC MEX 64,992.23 ▲ 1.13% MERVAL 2,893,751 ▼ 1.57% COLCAP 2,584.72 ▼ 0.95% BVL PERÚ 59,934.37 ▲ 1.27% USD/BRL 5.16 ▲ 0.01% USD/MXN 17.06 ▼ 0.24% USD/CLP 913.98 ▲ 0.04% USD/COP 3,140 ▲ 0.03% USD/PEN 3.36 ▼ 0.66% USD/ARS 1,493 ▲ 0.10% USD/UYU 40.27 ▲ 1.24% USD/PYG 5,939 ▲ 1.68% USD/BOB 11.64 ▼ 0.76% USD/DOP 58.34 ▲ 1.25% USD/CRC 445.92 ▲ 0.89% USD/GTQ 7.62 ▲ 2.21% USD/HNL 26.79 ▲ 1.57% USD/NIO 36.62 ▲ 0.69% USD/VES 762.44 ▼ 0.13% USD/PAB 1.00 — 0.00% USD/BZD 2.00 — 0.00% USD/JMD 157.28 — 0.00% USD/TTD 6.70 ▲ 0.61% EUR/BRL 5.95 ▲ 1.01% BRENT 88.88 ▼ 0.03% WTI 83.11 ▼ 0.11% IRON ORE 161.91 — — COPPER 6.61 ▲ 0.03% GOLD 4,461 ▲ 1.78% SILVER 65.59 ▲ 1.26% SOY 1,184 ▲ 3.20% CORN 480.50 ▲ 10.02% WHEAT 655.00 ▲ 3.93% COFFEE 317.25 ▼ 5.51% SUGAR 16.43 ▼ 1.79% ORANGE JUICE 138.55 ▼ 0.47% COTTON 85.03 ▲ 2.33% COCOA 5,719 ▲ 3.18% BEEF 223.60 ▼ 3.93% CATTLE 339.10 ▼ 3.16% LITHIUM 75.20 ▲ 1.47% PETR4 41.64 ▼ 0.05% VALE3 72.97 ▲ 0.83% ITUB4 38.60 ▼ 1.03% BBDC4 16.85 ▲ 0.36% ABEV3 14.89 ▼ 0.80% BBAS3 19.37 ▲ 0.47% B3SA3 14.26 ▼ 0.21% WEGE3 47.59 ▲ 0.49% PRIO3 59.14 ▼ 0.19% SUZB3 41.33 ▲ 2.35% RENT3 34.68 ▼ 0.09% AZZA3 15.89 ▼ 2.63% CSAN3 3.22 ▼ 1.83% RAIZ4 0.25 — 0.00% PCAR3 2.75 ▼ 0.36% GMAT3 3.65 ▼ 1.08% PSSA3 48.13 ▼ 0.54% CVCB3 1.33 ▼ 2.92% POSI3 3.36 ▲ 2.44% SLCE3 13.34 ▲ 0.30% NATU3 8.14 ▼ 0.73%
since 2009
Saturday, September 26, 2026

China’s Corporate Profits: A Mixed Bag in 2023

By · May 3, 2024 · 2 min read

The LatAm Brief

One email, every weekday morning. What moved in Latin American markets, politics and expat life.

Yesterday’s subject line: “The US Army is quietly planning for Cuba”

Free. We send a confirmation link first — nothing arrives until you click it. Unsubscribe with one click in any edition. If you stop opening us for 30 days we stop sending by ourselves, as we assume the interest is no longer there. See our privacy policy. We never share your email.

In 2023, China’s corporate landscape experienced varied outcomes, with non-financial firms reporting their first profit decline in five years.

These companies logged a combined profit of 2.85 trillion yuan ($399 billion), a decrease of 100 billion yuan ($14 billion), or about 3%.

This downturn was largely driven by a sluggish property market. It negatively impacted related sectors like steel and nonferrous metals, which saw declines of 13% and 29%, respectively.

The real estate sector recorded significant losses, totaling 13.5 billion yuan ($1.89 billion), marking its first loss since 2000.

Greenland Holdings, a notable state-backed entity, reported a substantial loss of 9.5 billion yuan ($1.33 billion), underscoring the sector’s challenges.
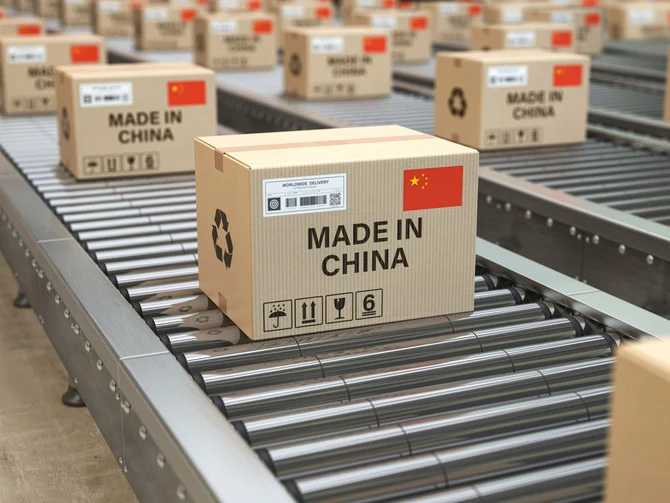
China's Corporate Profits: A Mixed Bag in 2023
China’s Corporate Profits: A Mixed Bag in 2023.
One-stop reference
Company Intelligence
Every listed company in Latin America — financials, ownership and structure for 1,450+ companies across 26 exchanges, in one place.
Browse the directory →
RT
Ask Rio Times
17 years of Latin America reporting, on demand.
Open the full Ask Rio Times →

This is particularly significant considering real estate contributes approximately 30% to China’s GDP.

Conversely, the auto industry demonstrated resilience, achieving a 5.9% increase in profits due to high production levels.

Leaders in this recovery were BYD and CATL, with profit increases of 81% and 44%, respectively, driving advances in electric vehicles and batteries.

Consumer-driven sectors also showed robust growth despite economic pressures, with the electronics and food industries recording profit increases of 14% and 17%, respectively.

However, deflationary risks and a slow real estate market pose threats to further spending, exacerbated by issues such as youth unemployment and declining wealth.

China’s Economic Landscape

Amid these challenges, China’s economy expanded by 5.2% in 2023.

Government support measures included a significant 50-basis point reduction in bank reserves, the largest cut in two years.

Additionally, there were plans to issue an additional 1 trillion yuan ($140 billion) in bonds to support economic stability.

Despite these interventions, corporate profits saw only modest improvements. Return on equity dropped to 7.7%, placing China behind other major economies like Japan and the U.S.

Ongoing international scrutiny, especially from the U.S. and EU regarding Chinese steel and EV exports, continues to complicate the economic outlook for 2024.

Despite current challenges, industrial profit forecasts remain cautiously optimistic.

There is an expected rise of 5% to 6% next year, reflecting a complex yet hopeful economic scenario for China.

This article was produced by The Rio Times’ automated newsroom system. How we use AI · Report an error

Read More from The Rio Times

The Rio Times · Power Map
See who really holds power in Latin America
Click to open the Power Map →

Rotate for Best Experience

This report is optimized for landscape viewing. Rotate your phone for the full experience.