Covid-19: Scotland’s official figures almost testify to ‘pandemic of the fully vaccinated’
RIO DE JANEIRO, BRAZIL – As elsewhere, the authorities are slowly tightening the noose around the necks of the British population. The reason for this is a suspected new Covid-19 variant called Omicron, which is feared to be able to circumvent the currently available Covid-19 vaccine.
The problem with this is official data shows the alleged Delta variant has been evading the Covid-19 vaccines for at least the three past months. Since August 2021, the fully vaccinated have accounted for 9 in every 10, Covid-19 deaths.
Public Health Scotland (PHS) publishes a weekly report on Covid-19 statistics, including data on cases, hospitalizations, and deaths by vaccination status.
The report includes data over four weeks. The latest statistics were published by PHS on December 1st, 2021, including data on cases and hospitalizations from October 30th to November 26th, 2021, and data on deaths from October 23rd to November 19th, 2021.
By analyzing the data contained within the report alongside data from previous reports that stretches as far back as August 14th, 2021, we can see that Scotland has very much been experiencing a ‘Pandemic of the Fully Vaccinated’ since at least August.
Proving the introduction of new restrictions has nothing to do with the worry that the new Omicron variant may impact the effectiveness of the Covid-19 vaccines and instead has everything to do with control because the jabs have proven to be ineffective for months.
COVID-19 CASES
Table 19 (page 43) of the latest ‘Covid-19 Statistical Report’ shows the number of Covid-19 cases per week by vaccination status. Daily Expose created the following chart on the published data from several reports, including the most recent posted on December 1st.

As you can see from the above, the unvaccinated population accounted for most cases every week between August 21st and September 17th. Since then, the fully vaccinated have accounted for most patients every week.
However, by including the number of cases among the partly vaccinated population, we find that the vaccinated population has accounted for most Covid-19 points since August 21st.
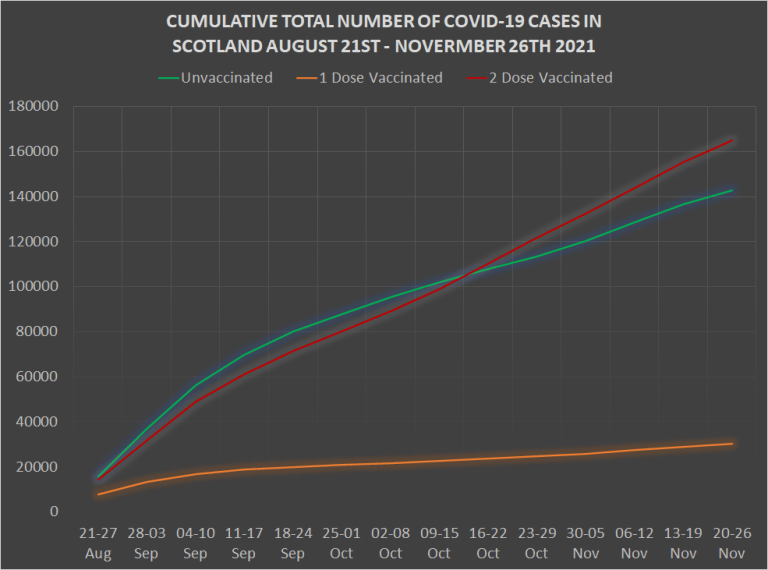
The above chart shows the cumulative number of cases per week by vaccination status between August 21st and November 26th. We can see something significant happened in the week beginning October 16th regarding the number of cases accumulating among the unvaccinated and fully vaccinated populations.
The number of cases was beginning to fall among the unvaccinated while increasing significantly among the fully immunized.
Official data shows that between August 21st and November 26th, there were 142,945 cases among the unvaccinated population, 30,204 cases among the partly vaccinated people, and 165,008 cases among the fully vaccinated, bringing the total number of cases among the vaccinated population in this time frame to 195,212.
COVID-19 HOSPITALIZATIONS
Table 20 (page 49) of the latest ‘Covid-19 Statistical Report shows the number of Covid-19 hospitalizations per week by vaccination status. Daily Expose has created the following chart on the published data from several reports, including the most recent posted on December 1st.
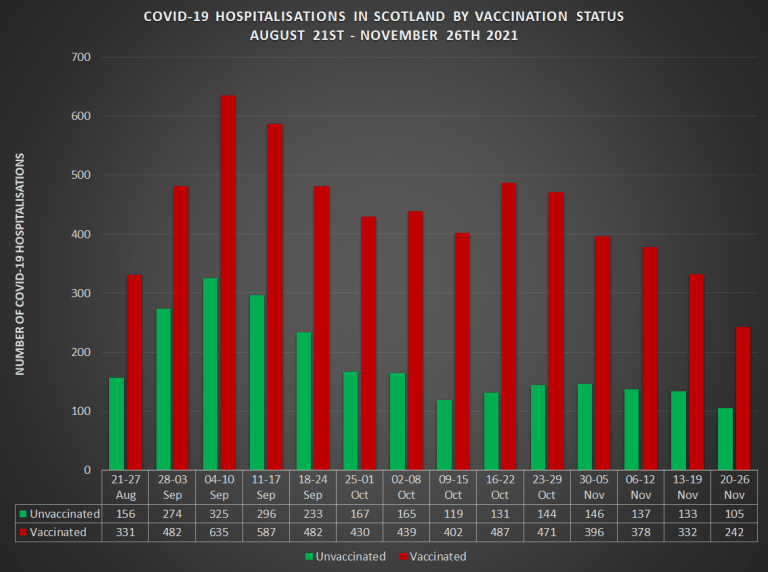
As you can see from the above, the data proves that the fully vaccinated population has been putting a strain on the healthcare system and not the unvaccinated as the authorities and mainstream media would have you believe.

The above chart shows the cumulative number of hospitalizations per week by vaccination status between August 21st and November 26th. There were 2,531 hospitalizations among the unvaccinated population but more than twice the vaccinated population, who recorded 6,094 hospitalizations.
COVID-19 DEATHS
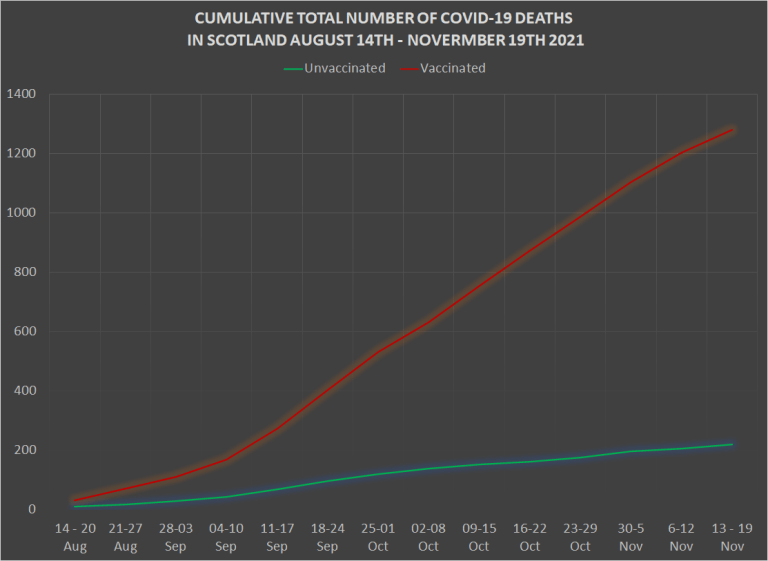
Table 21 (page 55) of the latest ‘Covid-19 Statistical Report’ shows the number of Covid-19 deaths per week by vaccination status. Daily Expose created the following chart on the published data from several reports, including the most recent posted on December 1st.

The data shows that the fully vaccinated have accounted for the vast majority of Covid-19 deaths by a long way since at least August 14th. In the past four weeks, there were just 59 deaths among the unvaccinated population, while 407 deaths occurred among the vaccinated population.
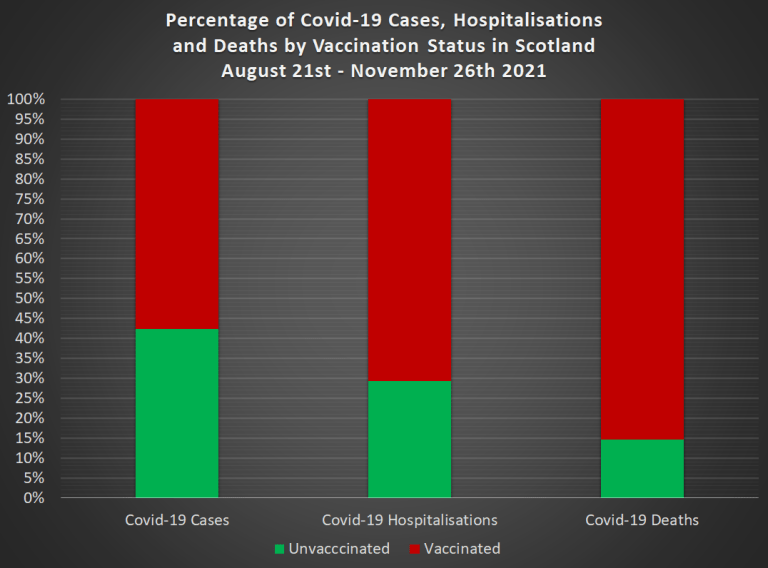
The vaccinated population accounted for 9 in every 10 Covid-19 deaths between October 23rd and November 19th.
The above chart shows the cumulative number of deaths per week by vaccination status between August 14th and November 19th. There were just 219 deaths among the unvaccinated population, but 1,280 deaths among the vaccinated population.
This data suggests that the fully vaccinated are 144% more likely to die once hospitalized with Covid-19 based on the hospitalization/fatality rates that can be calculated from the statistics.
With 2,531 hospitalizations and 219 deaths among the unvaccinated population, this equates to a hospitalization/fatality rate of 8.6%.
But with 6,094 hospitalizations and 1,280 deaths among the vaccinated population, this equates to a hospitalization/fatality rate of 21%.
THE PANDEMIC OF THE FULLY VACCINATED
The data available from Public Health Scotland stretching back 14 weeks proves that this is a pandemic of the fully vaccinated. With the vaccinated accounting for 6 in every 10 cases (57%), 7 in every ten hospitalizations (70%), and 9 in every 10 Covid-19 deaths (85%) since at least August, this also proves that the Covid-19 vaccines have already been ineffective for months.
Therefore any restrictions enforced in the name of protecting the public from the alleged new Omicron variant have most certainly nothing to do with protecting your health and instead everything to do with control.
This article was produced by The Rio Times’ automated newsroom system. How we use AI · Report an error
Read More from The Rio Times