IBOV 183,476.86 ▼ 0.27% IPSA 11,256.80 ▼ 0.38% IPC MEX 64,992.23 ▲ 1.13% MERVAL 2,893,751 ▼ 1.57% COLCAP 2,584.72 ▼ 0.95% BVL PERÚ 59,934.37 ▲ 1.27% USD/BRL5.19▼ 0.12% USD/MXN17.68▼ 0.27% USD/CLP960.63▼ 0.27% USD/COP3,293▲ 0.20% USD/PEN3.39▼ 0.67% USD/ARS1,525▲ 0.30% USD/UYU40.21▲ 3.50% USD/PYG5,870▲ 2.23% USD/BOB12.17▲ 2.05% USD/DOP59.35▲ 0.25% USD/CRC450.87▲ 2.53% USD/GTQ7.64▲ 3.22% USD/HNL26.85▲ 0.31% USD/NIO36.62▲ 2.66% USD/VES853.52▼ 0.13% USD/PAB1.00— 0.00% USD/BZD2.00— 0.00% USD/JMD 157.28 — 0.00% USD/TTD6.77▲ 2.72% EUR/BRL5.91▲ 0.63% BRENT 88.88 ▼ 0.03% WTI 83.11 ▼ 0.11% IRON ORE 161.91 — — COPPER 6.61 ▲ 0.03% GOLD 4,461 ▲ 1.78% SILVER 65.59 ▲ 1.26% SOY 1,184 ▲ 3.20% CORN 480.50 ▲ 10.02% WHEAT 655.00 ▲ 3.93% COFFEE 317.25 ▼ 5.51% SUGAR 16.43 ▼ 1.79% ORANGE JUICE 138.55 ▼ 0.47% COTTON 85.03 ▲ 2.33% COCOA 5,719 ▲ 3.18% BEEF 223.60 ▼ 3.93% CATTLE 339.10 ▼ 3.16% LITHIUM 75.20 ▲ 1.47% PETR4 41.64 ▼ 0.05% VALE3 72.97 ▲ 0.83% ITUB4 38.60 ▼ 1.03% BBDC4 16.85 ▲ 0.36% ABEV3 14.89 ▼ 0.80% BBAS3 19.37 ▲ 0.47% B3SA3 14.26 ▼ 0.21% WEGE3 47.59 ▲ 0.49% PRIO3 59.14 ▼ 0.19% SUZB3 41.33 ▲ 2.35% RENT3 34.68 ▼ 0.09% AZZA3 15.89 ▼ 2.63% CSAN3 3.22 ▼ 1.83% RAIZ4 0.25 — 0.00% PCAR3 2.75 ▼ 0.36% GMAT3 3.65 ▼ 1.08% PSSA3 48.13 ▼ 0.54% CVCB3 1.33 ▼ 2.92% POSI3 3.36 ▲ 2.44% SLCE3 13.34 ▲ 0.30% NATU3 8.14 ▼ 0.73% IBOV 183,476.86 ▼ 0.27% IPSA 11,256.80 ▼ 0.38% IPC MEX 64,992.23 ▲ 1.13% MERVAL 2,893,751 ▼ 1.57% COLCAP 2,584.72 ▼ 0.95% BVL PERÚ 59,934.37 ▲ 1.27% USD/BRL 5.16 ▲ 0.01% USD/MXN 17.06 ▼ 0.24% USD/CLP 913.98 ▲ 0.04% USD/COP 3,140 ▲ 0.03% USD/PEN 3.36 ▼ 0.66% USD/ARS 1,493 ▲ 0.10% USD/UYU 40.27 ▲ 1.24% USD/PYG 5,939 ▲ 1.68% USD/BOB 11.64 ▼ 0.76% USD/DOP 58.34 ▲ 1.25% USD/CRC 445.92 ▲ 0.89% USD/GTQ 7.62 ▲ 2.21% USD/HNL 26.79 ▲ 1.57% USD/NIO 36.62 ▲ 0.69% USD/VES 762.44 ▼ 0.13% USD/PAB 1.00 — 0.00% USD/BZD 2.00 — 0.00% USD/JMD 157.28 — 0.00% USD/TTD 6.70 ▲ 0.61% EUR/BRL 5.95 ▲ 1.01% BRENT 88.88 ▼ 0.03% WTI 83.11 ▼ 0.11% IRON ORE 161.91 — — COPPER 6.61 ▲ 0.03% GOLD 4,461 ▲ 1.78% SILVER 65.59 ▲ 1.26% SOY 1,184 ▲ 3.20% CORN 480.50 ▲ 10.02% WHEAT 655.00 ▲ 3.93% COFFEE 317.25 ▼ 5.51% SUGAR 16.43 ▼ 1.79% ORANGE JUICE 138.55 ▼ 0.47% COTTON 85.03 ▲ 2.33% COCOA 5,719 ▲ 3.18% BEEF 223.60 ▼ 3.93% CATTLE 339.10 ▼ 3.16% LITHIUM 75.20 ▲ 1.47% PETR4 41.64 ▼ 0.05% VALE3 72.97 ▲ 0.83% ITUB4 38.60 ▼ 1.03% BBDC4 16.85 ▲ 0.36% ABEV3 14.89 ▼ 0.80% BBAS3 19.37 ▲ 0.47% B3SA3 14.26 ▼ 0.21% WEGE3 47.59 ▲ 0.49% PRIO3 59.14 ▼ 0.19% SUZB3 41.33 ▲ 2.35% RENT3 34.68 ▼ 0.09% AZZA3 15.89 ▼ 2.63% CSAN3 3.22 ▼ 1.83% RAIZ4 0.25 — 0.00% PCAR3 2.75 ▼ 0.36% GMAT3 3.65 ▼ 1.08% PSSA3 48.13 ▼ 0.54% CVCB3 1.33 ▼ 2.92% POSI3 3.36 ▲ 2.44% SLCE3 13.34 ▲ 0.30% NATU3 8.14 ▼ 0.73%
since 2009
Saturday, September 26, 2026

Urban Property Prices Outpace Income Growth in India’s Top Cities

By · December 26, 2024 · 2 min read

The LatAm Brief

One email, every weekday morning. What moved in Latin American markets, politics and expat life.

Yesterday’s subject line: “The US Army is quietly planning for Cuba”

Free. We send a confirmation link first — nothing arrives until you click it. Unsubscribe with one click in any edition. If you stop opening us for 30 days we stop sending by ourselves, as we assume the interest is no longer there. See our privacy policy. We never share your email.

India’s real estate market showed remarkable resilience in 2024, defying expectations amid economic uncertainties. Housing sales in the top seven cities reached 4,59,650 units, a slight 4% decrease from 2023. However, the total sales value grew by 16% to ₹5.68 lakh crore ($66.70 billion), reflecting a significant price appreciation.

The market witnessed a 21% increase in average property prices across major cities. This surge stemmed from rising costs of land, labor, and building materials. Mumbai Metropolitan Region led sales with 1,55,335 units, followed by Pune with 81,090 units.

Developers adjusted their strategies to meet changing consumer preferences. The luxury segment saw a notable uptick in demand. Units priced over ₹10 million ($117,430) accounted for 41% of total sales across eight major markets. This shift indicated a growing appetite for premium housing among Indian buyers.

The commercial real estate sector also showed signs of recovery. Office leases hit record levels, with 53.3 million square feet leased in 2024. Cities like Bengaluru, Hyderabad, and Pune emerged as hotspots for commercial activity.
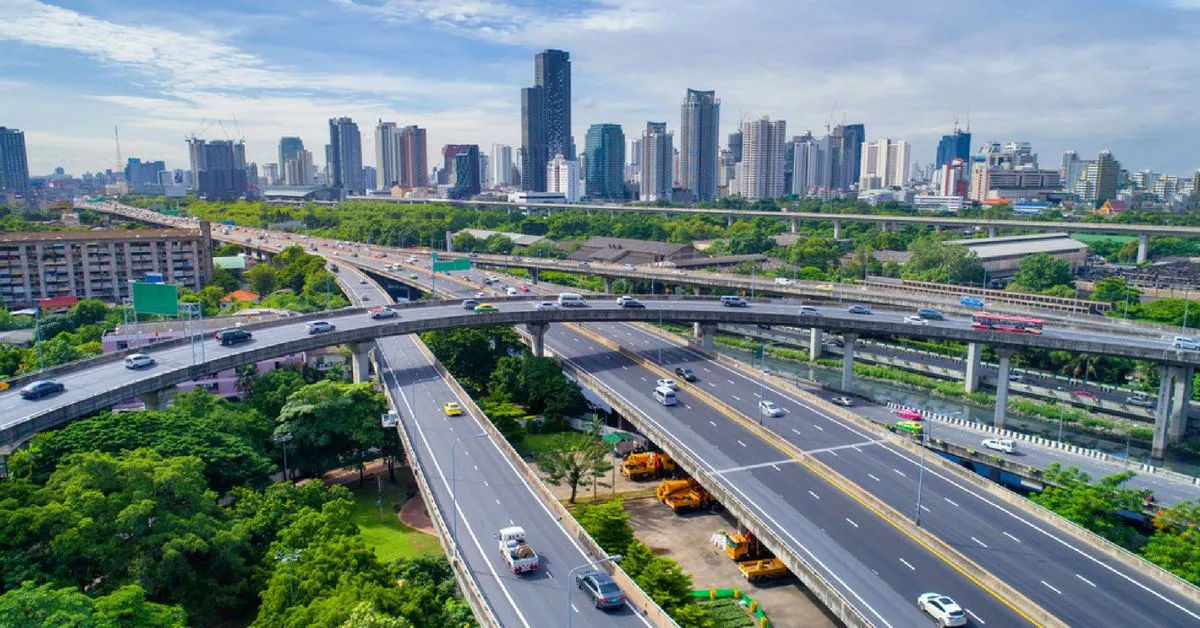
Urban Property Prices Outpace Income Growth in India's Top Cities - Hyderabad.
Urban Property Prices Outpace Income Growth in India’s Top Cities – Hyderabad.
One-stop reference
Company Intelligence
Every listed company in Latin America — financials, ownership and structure for 1,450+ companies across 26 exchanges, in one place.
Browse the directory →
RT
Ask Rio Times
17 years of Latin America reporting, on demand.
Open the full Ask Rio Times →

Foreign investments played a crucial role in market growth. Equity capital inflows reached $8.9 billion in the first nine months of 2024, a 46% year-on-year increase. This influx of foreign capital boosted investor confidence in the Indian real estate sector.

Government initiatives like the Pradhan Mantri Awas Yojana continued to support affordable housing. These programs aimed to make homeownership more accessible to first-time buyers and lower-income groups. Developers responded by focusing on smaller, more affordable units in some areas.

The market faced challenges too. New project launches declined by 7% to 4,12,520 units in 2024. This drop was attributed to delays in regulatory approvals, partly due to general and assembly elections. The slowdown in new supply could impact future market dynamics.

Urban Property Prices Outpace Income Growth in India’s Top Cities

Home loan rates remained relatively stable throughout the year. This stability, combined with rising incomes among young professionals, supported housing demand. The real estate sector emerged as a significant contributor to India’s economic growth in 2024.

Urbanization trends continued to drive market growth. More people moved to cities in search of better job opportunities and living conditions. This migration fueled demand for both residential and commercial properties in urban centers.

The market showed regional variations. While some cities like Mumbai and Bengaluru saw sales growth, others like Kolkata experienced declines. In Hyderabad, prices jumped to Rs 7,300 ($85) per square foot from Rs 5,750 ($67) in 2023. Mumbai’s prices ranged from Rs 21,900 ($257) to Rs 22,200 ($260) per square foot.

Looking ahead, experts predict continued growth in the Indian real estate sector. The market’s ability to adapt to changing consumer preferences and economic conditions will be crucial. As India’s economy expands, the real estate market is poised to play an increasingly important role in the country’s development.

This article was produced by The Rio Times’ automated newsroom system. How we use AI · Report an error

Read More from The Rio Times

The Rio Times · Power Map
See who really holds power in Latin America
Click to open the Power Map →

Rotate for Best Experience

This report is optimized for landscape viewing. Rotate your phone for the full experience.