IBOV 183,476.86 ▼ 0.27% IPSA 11,255.90 ▼ 0.39% IPC MEX 64,992.23 ▲ 1.13% MERVAL 2,893,751 ▼ 1.57% COLCAP 2,584.72 ▼ 0.95% BVL PERÚ 59,934.37 ▲ 1.27% USD/BRL5.19▼ 0.12% USD/MXN17.68▼ 0.27% USD/CLP960.63▼ 0.27% USD/COP3,293▲ 0.20% USD/PEN3.39▼ 0.67% USD/ARS1,525▲ 0.30% USD/UYU40.21▲ 3.50% USD/PYG5,870▲ 2.23% USD/BOB12.17▲ 2.05% USD/DOP59.35▲ 0.25% USD/CRC450.87▲ 2.53% USD/GTQ7.64▲ 3.22% USD/HNL26.85▲ 0.31% USD/NIO36.62▲ 2.66% USD/VES853.52▼ 0.13% USD/PAB1.00— 0.00% USD/BZD2.00— 0.00% USD/JMD 157.28 — 0.00% USD/TTD6.77▲ 2.72% EUR/BRL5.91▲ 0.63% BRENT 88.88 ▼ 0.03% WTI 83.11 ▼ 0.11% IRON ORE 161.91 — — COPPER 6.61 ▲ 0.03% GOLD 4,461 ▲ 1.78% SILVER 65.59 ▲ 1.26% SOY 1,184 ▲ 3.20% CORN 480.50 ▲ 10.02% WHEAT 655.00 ▲ 3.93% COFFEE 317.25 ▼ 5.51% SUGAR 16.43 ▼ 1.79% ORANGE JUICE 138.55 ▼ 0.47% COTTON 85.03 ▲ 2.33% COCOA 5,719 ▲ 3.18% BEEF 223.60 ▼ 3.93% CATTLE 339.10 ▼ 3.16% LITHIUM 75.20 ▲ 1.47% PETR4 41.64 ▼ 0.05% VALE3 72.97 ▲ 0.83% ITUB4 38.60 ▼ 1.03% BBDC4 16.85 ▲ 0.36% ABEV3 14.89 ▼ 0.80% BBAS3 19.37 ▲ 0.47% B3SA3 14.26 ▼ 0.21% WEGE3 47.59 ▲ 0.49% PRIO3 59.14 ▼ 0.19% SUZB3 41.33 ▲ 2.35% RENT3 34.68 ▼ 0.09% AZZA3 15.89 ▼ 2.63% CSAN3 3.22 ▼ 1.83% RAIZ4 0.25 — 0.00% PCAR3 2.75 ▼ 0.36% GMAT3 3.65 ▼ 1.08% PSSA3 48.13 ▼ 0.54% CVCB3 1.33 ▼ 2.92% POSI3 3.36 ▲ 2.44% SLCE3 13.34 ▲ 0.30% NATU3 8.14 ▼ 0.73% IBOV 183,476.86 ▼ 0.27% IPSA 11,255.90 ▼ 0.39% IPC MEX 64,992.23 ▲ 1.13% MERVAL 2,893,751 ▼ 1.57% COLCAP 2,584.72 ▼ 0.95% BVL PERÚ 59,934.37 ▲ 1.27% USD/BRL 5.16 ▲ 0.01% USD/MXN 17.06 ▼ 0.24% USD/CLP 913.98 ▲ 0.04% USD/COP 3,140 ▲ 0.03% USD/PEN 3.36 ▼ 0.66% USD/ARS 1,493 ▲ 0.10% USD/UYU 40.27 ▲ 1.24% USD/PYG 5,939 ▲ 1.68% USD/BOB 11.64 ▼ 0.76% USD/DOP 58.34 ▲ 1.25% USD/CRC 445.92 ▲ 0.89% USD/GTQ 7.62 ▲ 2.21% USD/HNL 26.79 ▲ 1.57% USD/NIO 36.62 ▲ 0.69% USD/VES 762.44 ▼ 0.13% USD/PAB 1.00 — 0.00% USD/BZD 2.00 — 0.00% USD/JMD 157.28 — 0.00% USD/TTD 6.70 ▲ 0.61% EUR/BRL 5.95 ▲ 1.01% BRENT 88.88 ▼ 0.03% WTI 83.11 ▼ 0.11% IRON ORE 161.91 — — COPPER 6.61 ▲ 0.03% GOLD 4,461 ▲ 1.78% SILVER 65.59 ▲ 1.26% SOY 1,184 ▲ 3.20% CORN 480.50 ▲ 10.02% WHEAT 655.00 ▲ 3.93% COFFEE 317.25 ▼ 5.51% SUGAR 16.43 ▼ 1.79% ORANGE JUICE 138.55 ▼ 0.47% COTTON 85.03 ▲ 2.33% COCOA 5,719 ▲ 3.18% BEEF 223.60 ▼ 3.93% CATTLE 339.10 ▼ 3.16% LITHIUM 75.20 ▲ 1.47% PETR4 41.64 ▼ 0.05% VALE3 72.97 ▲ 0.83% ITUB4 38.60 ▼ 1.03% BBDC4 16.85 ▲ 0.36% ABEV3 14.89 ▼ 0.80% BBAS3 19.37 ▲ 0.47% B3SA3 14.26 ▼ 0.21% WEGE3 47.59 ▲ 0.49% PRIO3 59.14 ▼ 0.19% SUZB3 41.33 ▲ 2.35% RENT3 34.68 ▼ 0.09% AZZA3 15.89 ▼ 2.63% CSAN3 3.22 ▼ 1.83% RAIZ4 0.25 — 0.00% PCAR3 2.75 ▼ 0.36% GMAT3 3.65 ▼ 1.08% PSSA3 48.13 ▼ 0.54% CVCB3 1.33 ▼ 2.92% POSI3 3.36 ▲ 2.44% SLCE3 13.34 ▲ 0.30% NATU3 8.14 ▼ 0.73%
since 2009
Saturday, September 26, 2026

Africa Western Africa

Senegal’s Trade Balance Worsens in May 2024

By · July 8, 2024 · 2 min read

Africa Intelligence

One email, every weekday morning. African markets, politics and business — filed from our newsroom in Rio.

Yesterday’s subject line: “Europe's carbon toll is up — Africa answers with a fence”

Free. We send a confirmation link first — nothing arrives until you click it. Unsubscribe with one click in any edition. If you stop opening us for 30 days we stop sending by ourselves, as we assume the interest is no longer there. See our privacy policy. We never share your email.

Senegal’s trade balance worsened in May 2024, marked by a decline in exports and a rise in imports, according to the National Agency of Statistics and Demography (ANSD).

In May 2024, Senegal’s exports dropped to 269.8 billion CFA francs ($445.17 million) from 278.9 billion CFA francs ($460.19 million) in April.

This 3.3% decrease resulted from declines in several key sectors. Canned fish and fresh vegetables saw significant drops of 83.8% and 61.4%, respectively.

Phosphoric acid and mineral and chemical fertilizers also fell by 58.4% and 45.4%, respectively. Even non-monetary gold, a traditional export, declined by 9.8%.

Despite these setbacks, some sectors showed growth. Titanium exports increased by 55.0%, while soup and broth preparations rose by 50.8%.
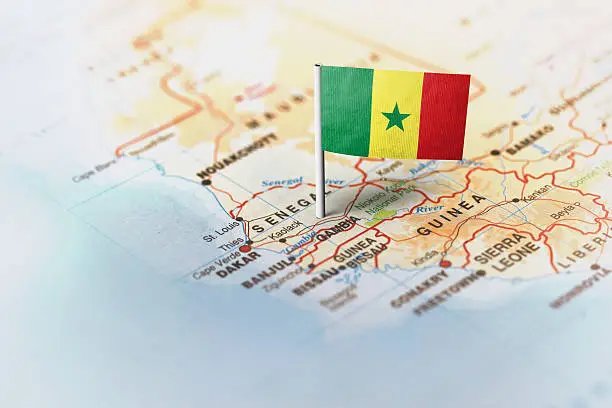
Senegal's Trade Balance Worsens in May 2024
Senegal’s Trade Balance Worsens in May 2024.
One-stop reference
Company Intelligence
Every listed company in Latin America — financials, ownership and structure for 1,450+ companies across 26 exchanges, in one place.
Browse the directory →
RT
Ask Rio Times
17 years of Latin America reporting, on demand.
Open the full Ask Rio Times →

Hydraulic cement and petroleum products also saw gains of 29.7% and 22.7%, respectively.

Meanwhile, imports grew from 584.8 billion CFA francs ($964.92 million) in April to 609.7 billion CFA francs ($1.00 billion) in May, an increase of 4.3%.

This was driven by higher demand in various sectors. Rice imports surged by 220.5%, likely due to stockpiling or anticipated shortages.

Metal goods and pharmaceutical products also saw increases of 75.3% and 29.5%, respectively.

Senegal’s Trade Deficit and Economic Dynamics

The trade deficit widened from 305.9 billion CFA francs ($504.73 million) in April to 340.0 billion CFA francs ($561.00 million) in May. This deterioration was especially notable in trade with Russia.

The deficit nearly doubled from 38.2 billion CFA francs ($63.03 million) to 60.5 billion CFA francs ($99.83 million). Trade with Turkey and Germany also saw declines.

However, there were some positive signs. The trade deficit with the Netherlands, Brazil, and China narrowed, partially offsetting the overall trade balance deterioration.

Senegal’s diverse trade relationships with various partners for both exports and imports help maintain economic stability.

These trade dynamics matter as they reflect the broader economic health and stability of Senegal.

Understanding the shifts in export and import patterns helps policymakers and businesses adapt strategies for future growth and stability.

This article was produced by The Rio Times’ automated newsroom system. How we use AI · Report an error

Part of our ongoing coverage

Africa: The New Scramble — the great-power contest over the continent.

More from Western Africa

Read More from The Rio Times

The Rio Times · Power Map
See who really holds power in Latin America
Click to open the Power Map →

Rotate for Best Experience

This report is optimized for landscape viewing. Rotate your phone for the full experience.