IBOV 185,147.15 ▼ 0.02% IPSA 11,315.26 ▼ 1.14% IPC MEX 64,639.55 ▼ 0.35% MERVAL 3,041,993 ▼ 0.23% COLCAP 2,556.17 ▲ 0.46% BVL PERÚ 59,789.81 ▼ 0.24% USD/BRL5.13▼ 0.01% USD/MXN16.92▲ 0.24% USD/CLP933.80▼ 0.08% USD/COP3,120▼ 0.31% USD/PEN3.36▲ 0.10% USD/ARS1,510▲ 0.08% USD/UYU40.24— 0.00% USD/PYG5,947— 0.00% USD/BOB12.40— 0.00% USD/DOP59.00— 0.00% USD/CRC448.67— 0.00% USD/GTQ7.63— 0.00% USD/HNL26.84— 0.00% USD/NIO36.62— 0.00% USD/VES811.71▲ 0.66% USD/PAB1.00— 0.00% USD/BZD2.00— 0.00% USD/JMD 157.28 — 0.00% USD/TTD6.71— 0.00% EUR/BRL5.96▲ 0.24% BRENT 88.88 ▼ 0.03% WTI 83.11 ▼ 0.11% IRON ORE 161.91 — — COPPER 6.61 ▲ 0.03% GOLD 4,461 ▲ 1.78% SILVER 65.59 ▲ 1.26% SOY 1,184 ▲ 3.20% CORN 480.50 ▲ 10.02% WHEAT 655.00 ▲ 3.93% COFFEE 317.25 ▼ 5.51% SUGAR 16.43 ▼ 1.79% ORANGE JUICE 138.55 ▼ 0.47% COTTON 85.03 ▲ 2.33% COCOA 5,719 ▲ 3.18% BEEF 223.60 ▼ 3.93% CATTLE 339.10 ▼ 3.16% LITHIUM 75.20 ▲ 1.47% PETR4 41.64 ▼ 0.05% VALE3 72.97 ▲ 0.83% ITUB4 38.60 ▼ 1.03% BBDC4 16.85 ▲ 0.36% ABEV3 14.89 ▼ 0.80% BBAS3 19.37 ▲ 0.47% B3SA3 14.26 ▼ 0.21% WEGE3 47.59 ▲ 0.49% PRIO3 59.14 ▼ 0.19% SUZB3 41.33 ▲ 2.35% RENT3 34.68 ▼ 0.09% AZZA3 15.89 ▼ 2.63% CSAN3 3.22 ▼ 1.83% RAIZ4 0.25 — 0.00% PCAR3 2.75 ▼ 0.36% GMAT3 3.65 ▼ 1.08% PSSA3 48.13 ▼ 0.54% CVCB3 1.33 ▼ 2.92% POSI3 3.36 ▲ 2.44% SLCE3 13.34 ▲ 0.30% NATU3 8.14 ▼ 0.73% IBOV 185,147.15 ▼ 0.02% IPSA 11,315.26 ▼ 1.14% IPC MEX 64,639.55 ▼ 0.35% MERVAL 3,041,993 ▼ 0.23% COLCAP 2,556.17 ▲ 0.46% BVL PERÚ 59,789.81 ▼ 0.24% USD/BRL 5.16 ▲ 0.01% USD/MXN 17.06 ▼ 0.24% USD/CLP 913.98 ▲ 0.04% USD/COP 3,140 ▲ 0.03% USD/PEN 3.36 ▼ 0.66% USD/ARS 1,493 ▲ 0.10% USD/UYU 40.27 ▲ 1.24% USD/PYG 5,939 ▲ 1.68% USD/BOB 11.64 ▼ 0.76% USD/DOP 58.34 ▲ 1.25% USD/CRC 445.92 ▲ 0.89% USD/GTQ 7.62 ▲ 2.21% USD/HNL 26.79 ▲ 1.57% USD/NIO 36.62 ▲ 0.69% USD/VES 762.44 ▼ 0.13% USD/PAB 1.00 — 0.00% USD/BZD 2.00 — 0.00% USD/JMD 157.28 — 0.00% USD/TTD 6.70 ▲ 0.61% EUR/BRL 5.95 ▲ 1.01% BRENT 88.88 ▼ 0.03% WTI 83.11 ▼ 0.11% IRON ORE 161.91 — — COPPER 6.61 ▲ 0.03% GOLD 4,461 ▲ 1.78% SILVER 65.59 ▲ 1.26% SOY 1,184 ▲ 3.20% CORN 480.50 ▲ 10.02% WHEAT 655.00 ▲ 3.93% COFFEE 317.25 ▼ 5.51% SUGAR 16.43 ▼ 1.79% ORANGE JUICE 138.55 ▼ 0.47% COTTON 85.03 ▲ 2.33% COCOA 5,719 ▲ 3.18% BEEF 223.60 ▼ 3.93% CATTLE 339.10 ▼ 3.16% LITHIUM 75.20 ▲ 1.47% PETR4 41.64 ▼ 0.05% VALE3 72.97 ▲ 0.83% ITUB4 38.60 ▼ 1.03% BBDC4 16.85 ▲ 0.36% ABEV3 14.89 ▼ 0.80% BBAS3 19.37 ▲ 0.47% B3SA3 14.26 ▼ 0.21% WEGE3 47.59 ▲ 0.49% PRIO3 59.14 ▼ 0.19% SUZB3 41.33 ▲ 2.35% RENT3 34.68 ▼ 0.09% AZZA3 15.89 ▼ 2.63% CSAN3 3.22 ▼ 1.83% RAIZ4 0.25 — 0.00% PCAR3 2.75 ▼ 0.36% GMAT3 3.65 ▼ 1.08% PSSA3 48.13 ▼ 0.54% CVCB3 1.33 ▼ 2.92% POSI3 3.36 ▲ 2.44% SLCE3 13.34 ▲ 0.30% NATU3 8.14 ▼ 0.73%
since 2009
Monday, September 7, 2026

Mexico’s FDI Hits $35.7B in Q3 2024, Up 8.5% Year-on-Year

By · November 14, 2024 · 2 min read

Daily Brief

The morning intel from across Latin America. Free.

By subscribing you agree to our privacy policy. We never share your email.

Mexico’s economy has demonstrated remarkable resilience in 2024. Foreign Direct Investment (FDI) reached $35.732 billion in the first nine months of the year.

This figure marks an 8.5% increase from the same period in 2023. Marcelo Ebrard, Mexico’s Secretary of Economy, announced these encouraging results.

The investment inflow showcases Mexico’s appeal to international investors. Ebrard projects total FDI for 2024 could hit $38.172 billion.

This forecast suggests an additional $2.44 billion influx in the fourth quarter. The first two quarters combined saw $31.1 billion, while the third quarter added $4.632 billion.

Manufacturing remains a key sector for FDI in Mexico. Earlier data from 2024 indicated 54% of investments went to manufacturing.
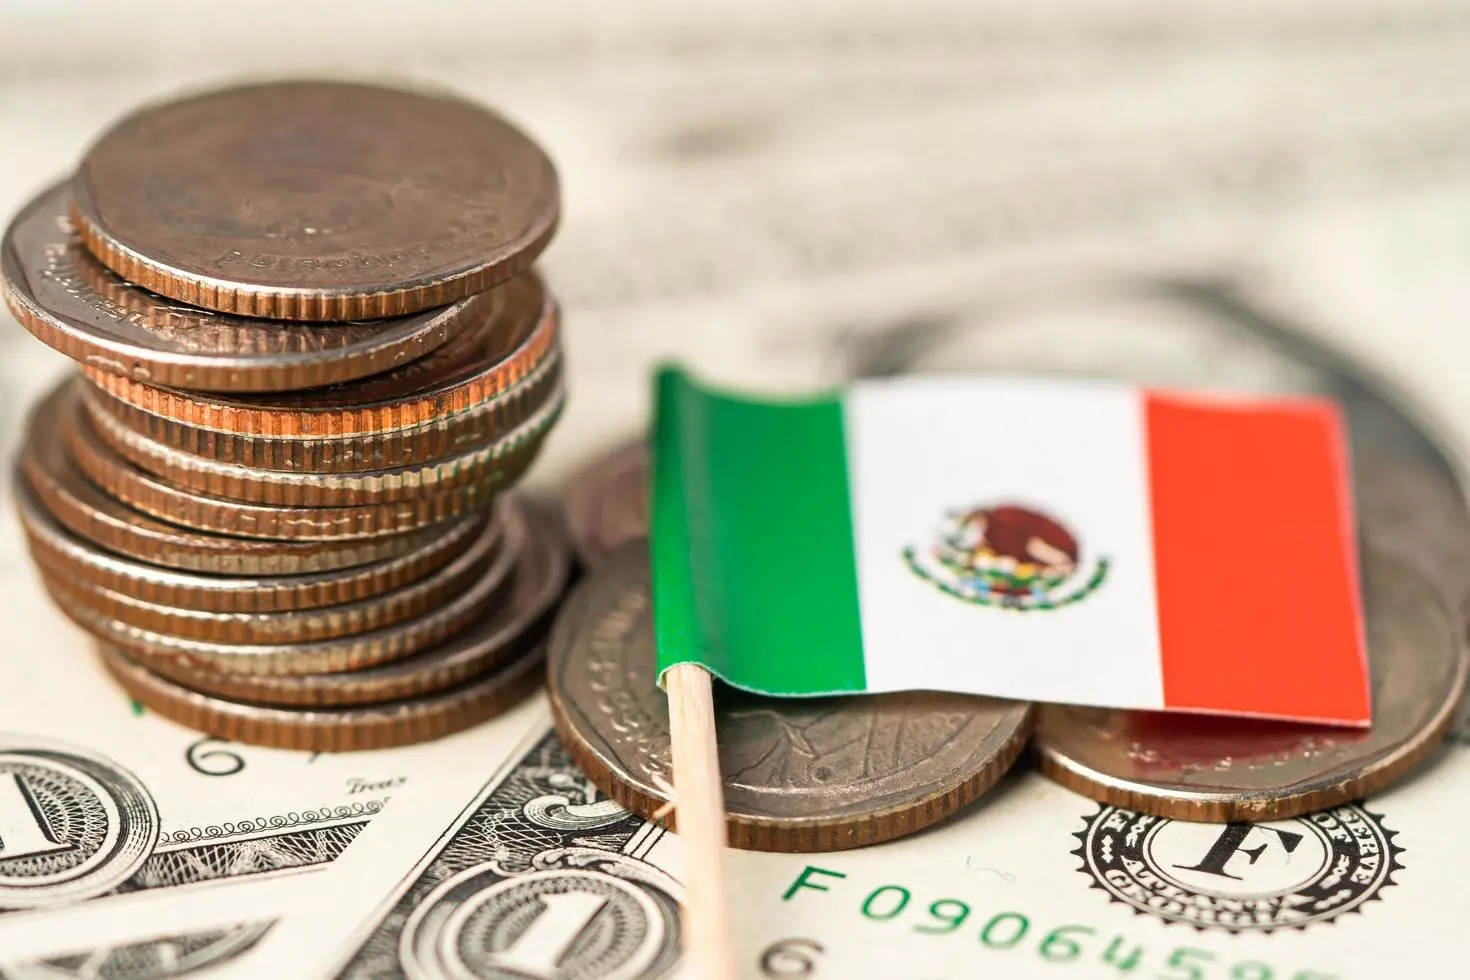
Mexico's FDI Hits $35.7B in Q3 2024, Up 8.5% Year-on-Year
Mexico’s FDI Hits $35.7B in Q3 2024, Up 8.5% Year-on-Year.
One-stop reference
Company Intelligence
Every listed company in Latin America — financials, ownership and structure for 1,450+ companies across 26 exchanges, in one place.
Browse the directory →
RT
Ask Rio Times
17 years of Latin America reporting, on demand.
Open the full Ask Rio Times →

The United States and Canada continue to be major investors. These North American neighbors accounted for 41% of 567 investment announcements between 2023 and August 2024.

Nuevo León has emerged as a significant FDI recipient within Mexico. The state attracted $4.857 billion from January 2023 to June 2024.

This amount represents 7.2% of Mexico‘s total FDI during that period. Nuevo León now ranks second among Mexican states for FDI attraction.

Mexico’s Economic Recovery and Future Outlook

Mexico’s economic landscape has been complex. After a slight contraction in late 2023, growth resumed in 2024. The third quarter saw a 1.5% year-over-year increase.

This growth surpassed market expectations and ended a streak of seven quarters of deceleration. Trade relations with the United States remain crucial for Mexico’s economy.

Mexican exports to the U.S. have grown 39% over six years. The United States-Mexico-Canada Agreement (USMCA) has played a role in this growth.

Nearshoring is expected to boost Mexico’s future FDI inflows. The Mexican Council for Foreign Trade projects an additional $48 billion in FDI over two to three years.

This trend reflects global companies relocating supply chains closer to North American markets. Despite positive figures, challenges persist for Mexico’s economic growth.

Projections for 2024 and beyond have been adjusted downward. Factors include expectations of moderate private investment and slower U.S. manufacturing growth.

Mexico’s ability to maintain this growth trajectory remains uncertain. Global economic conditions, domestic policies, and Mexico’s investment appeal will play crucial roles. The country’s economic future depends on navigating these complex factors effectively.

Key Facts

Deep Dive

For the complete picture, read our in-depth guide: Mexico Economy 2026: GDP, Peso, Nearshoring, Banxico and Trade

This article was produced by The Rio Times’ automated newsroom system. How we use AI · Report an error

Read More from The Rio Times

The Rio Times · Power Map
See who really holds power in Latin America
Click to open the Power Map

Rotate for Best Experience

This report is optimized for landscape viewing. Rotate your phone for the full experience.