Gold Surges Past $5,400 as Iran War Triggers Safe-Haven Rush
Gold & Silver Daily Report • March 2, 2026 • Data as of Feb 27 close
This is part of The Rio Times’ daily coverage of precious metals markets and Latin American financial markets.
\n
\n
\n02
\n
Market Commentary
\n
\n
The killing of Ayatollah Ali Khamenei in US-Israeli airstrikes on Saturday transformed what had been a consolidating precious metals market into a full-blown geopolitical safe-haven trade. Gold surged $126 on the day to close at $5,405.53, its highest level in four weeks and within 3.3% of the January 28 all-time high of $5,589.38. The move came despite the DXY surging to 98 — normally a heavy headwind for dollar-denominated commodities — underscoring the exceptional strength of the fear bid.
\n
\n
\n
\n
The contrast with crypto was stark: while Bitcoin plunged to $63,000 on the same headlines before a mechanical bounce, gold moved in a straight line higher. The “digital gold” thesis has now been tested in a genuine military crisis and failed — bullion absorbed the safe-haven flows that crypto advocates long claimed Bitcoin would capture. CNBC quoted Ross Norman calling gold “the finest barometer of global uncertainty” and predicting it should be repriced to fresh records.
\n
Silver’s 2.21% rally to $95.82 was strong but more measured. The white metal’s intraday range of $91.99–$96.37 reflected competing forces: safe-haven demand pulled it higher, while fears that a Strait of Hormuz closure could disrupt industrial supply chains (silver is critical for solar panels, semiconductors, and EVs) injected caution. Brent crude’s 2.45% rise to $72.48 — with Bloomberg reporting it spiked as much as 13% above $82 during Asian Monday trading — adds an inflationary dimension that historically benefits precious metals.
\n
\n
\n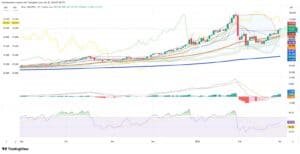
\n
On the institutional front, JPMorgan maintained its $6,300 year-end target, while Goldman Sachs held at $5,400 and Bank of America reiterated the path toward $6,000. Central bank purchases continue at approximately 60 tonnes per month, far above the pre-2022 average of 17 tonnes. Gold has gained roughly 25% year-to-date and posted its seventh consecutive monthly gain — the longest such streak since 1973. The structural bull case remains firmly intact.
\n
\n
\n
\n
\n
\n03
\n
Technical Analysis
\n
\n
\n
Gold — XAU/USD
\n
Trend: Decisively bullish. Price closed at $5,405.53, well above the Ichimoku cloud (cloud top at $5,165.03), the Tenkan-sen ($5,136.47), and the Kijun-sen ($5,068.23). The 200-SMA sits at $3,969.98 — price is 36% above the long-term mean, reflecting the extraordinary strength of the uptrend. The close above the Bollinger upper band ($5,343.34) signals a volatility breakout, with the band likely to expand further.
\n
Momentum: RSI reads 65.51 / 57.14 — strong but not yet overbought (70 threshold). The MACD configuration is bullish: signal line at 125.07, MACD line at 105.72, histogram at +19.34. All three are positive and rising, confirming upside momentum. No divergence is present.
\n
Structure: The $5,300–$5,400 zone is being reclaimed after the January/February correction from the $5,589 ATH. A daily close above $5,400 — achieved today — puts the January high back in play. The Bollinger band breakout and expanding bands suggest the move has legs.
\n
\n
\n
\n
| Gold Level | Price | Note |
|---|---|---|
| Resistance 3 | 5,589 | All-time high (Jan 28) |
| Resistance 2 | 5,419 | Session high |
| Resistance 1 | 5,343 | Bollinger upper band |
| Close | 5,405.53 | Mar 1 close |
| Support 1 | 5,165 | Bollinger mid / Ichimoku cloud top |
| Support 2 | 5,068 | Kijun-sen |
| Support 3 | 5,000 | Psychological / Feb consolidation floor |
\n
\n
Silver — XAG/USD
\n
Trend: Bullish, testing upper boundaries. Price closed at $95.82, above the Ichimoku cloud (cloud band $86.95–$88.58) and near the Bollinger upper band at $96.05. The 200-SMA sits at $54.07, placing price 77% above the long-term mean — an extreme extension but consistent with silver’s structural repricing since mid-2025. The Tenkan-sen ($92.83) and Kijun-sen ($88.58) both slope upward.
\n
Momentum: RSI reads 59.92 / 50.23 — firmly neutral, leaving substantial room for further upside before overbought conditions. The MACD is constructive: signal at 1.718, MACD line at 1.591, histogram at +0.128. All three are positive but the narrow histogram suggests momentum is building rather than fully extended.
\n
Structure: Silver’s $4.37 intraday range ($91.99–$96.37) reflects high volatility around the $95 pivot. The close above $95 is constructive. A sustained break above $96.05 (Bollinger upper) targets the psychological $100 level. The wide gap between the ATH at $121.62 and current price (−21.2%) suggests silver has significant room to reclaim lost ground if safe-haven + industrial demand converge.
\n
\n
\n
\n
| Silver Level | Price | Note |
|---|---|---|
| Resistance 3 | 121.62 | All-time high (Jan 29) |
| Resistance 2 | 100.00 | Psychological level |
| Resistance 1 | 96.05 | Bollinger upper band |
| Close | 95.824 | Mar 1 close |
| Support 1 | 92.83 | Tenkan-sen |
| Support 2 | 88.58 | Kijun-sen / Ichimoku cloud top |
| Support 3 | 84.83 | Bollinger lower band |
\n
\n
\n
\n04
\n
Live Market IntelligenceCommodities — Live Market Board
Rio Times · Live Market Intelligence
Commodities — Live Market Board
-0.03%
| Instrument | Last | Change | YoY | Prev. | High | Low | Volume |
|---|---|---|---|---|---|---|---|
| GOLD | 4,461 | +1.78% | +33.20% | 4,383 | 4,503 | 4,421 | 139,824 |
| SILVER | 65.59 | +1.26% | +73.05% | 64.77 | 66.98 | 64.81 | 46,406 |
| BRENT | 88.88 | -0.03% | +34.42% | 88.91 | 90.07 | 88.12 | 29,713 |
| WTI | 83.11 | -0.11% | +31.57% | 83.20 | 84.35 | 82.40 | 166,848 |
| COPPER | 6.61 | +0.03% | +46.70% | 6.61 | 6.71 | 6.61 | 39,543 |
| LITHIUM | 75.20 | +1.47% | +62.95% | 74.11 | 75.80 | 75.08 | 89,275 |
| IRON ORE | 161.91 | — | +58.10% | 161.91 | 161.91 | 1 | |
| SOY | 1,184 | +3.20% | +17.05% | 1,148 | 1,199 | 1,168 | 163,179 |
| CORN | 480.50 | +10.02% | +29.34% | 436.75 | 480.75 | 459.50 | 341,248 |
| WHEAT | 655.00 | +3.93% | +29.70% | 630.25 | 657.75 | 631.50 | 128,793 |
| COFFEE | 317.25 | -5.51% | +0.67% | 335.75 | 321.20 | 313.55 | 21,747 |
| SUGAR | 16.43 | -1.79% | -3.01% | 16.73 | 17.11 | 16.22 | 171,992 |
| COCOA | 5,719 | +3.18% | -34.96% | 5,543 | 5,779 | 5,574 | 26,773 |
| ORANGE JUICE | 138.55 | -0.47% | -45.38% | 139.20 | 141.05 | 137.50 | 703 |
| COTTON | 85.03 | +2.33% | +26.78% | 83.09 | 82.90 | 81.96 | 16,546 |
| BEEF | 223.60 | -3.93% | -5.18% | 232.75 | 226.40 | 223.00 | 16,126 |
| CATTLE | 339.10 | -3.16% | -1.82% | 350.17 | 345.50 | 338.60 | 10,164 |
| USD/BRL | 5.16 | +0.01% | -5.13% | 5.16 | 5.18 | 5.14 | — |
Forward Look
\n
\n
Key Facts
—Monday COMEX Open & Strait of Hormuz. Gold futures technical targets project $5,608 if bullish momentum holds through Monday’s session. However, the Strait of Hormuz closure risk is the wildcard — marine insurers have already cancelled war-risk cover for ships in Iranian and Gulf waters effective March 5. A sustained closure could spike Brent above $100, amplifying the inflationary case for gold but also triggering recession fears that could dent silver’s industrial demand.
—US Labor Data This Week. ADP employment report, weekly jobless claims, and Friday’s non-farm payrolls all land this week. Strong employment data would reinforce the Fed’s hawkish hold, compressing rate-cut expectations. But in the current geopolitical environment, safe-haven demand may dominate over rate-differential logic — gold rallied 2.4% alongside a 0.5% DXY surge, breaking the normal inverse correlation.
—Silver’s $100 Test. The close at $95.82 puts silver within 4.4% of the triple-digit milestone. A Bollinger upper band breakout above $96.05, combined with continued safe-haven flows and industrial supply fears, could propel the white metal to $100 this week. The neutral RSI at 59.92 supports room for further upside without hitting overbought conditions.
—Institutional Consensus. JPMorgan ($6,300), BofA (~$6,000), Goldman ($5,400), and Wells Fargo (buy-the-dip) are all bullish. Central bank buying at 60 tonnes/month continues to provide a structural floor. The Thailand-based Mae Thong Suk dealer warned that prolonged fighting could lift gold to $7,000 and domestic bullion above record levels. Whether this crisis produces a spike-and-fade or a sustained repricing depends entirely on whether the Strait of Hormuz stays open.
\n
\n
\n
\n⚖
\n
Verdict
\n
\n
Key Facts
—Gold Bias: Strong Buy. Geopolitical regime shock, central bank demand, and institutional consensus all point higher.
—Silver Bias: Buy. Safe-haven bid plus approaching $100 milestone, but Strait of Hormuz industrial risk warrants caution.
— Gold closed at $5,405.53 — its best daily close in a month — and did so while the dollar strengthened to a five-week high. That inverse-correlation break is the single most bullish signal in the report. When gold and the dollar rise together, it means the safe-haven bid is overwhelming everything else. Seven consecutive monthly gains, 25% YTD, and only 3.3% from the all-time high with a widening Middle East war as tailwind.
— Silver at $95.82 is the more nuanced trade. The white metal needs to clear $96.05 (Bollinger upper) and hold to confirm the breakout toward $100. Its 21% distance from the ATH at $121.62 represents either a massive catch-up opportunity or a warning that silver’s January blow-off top may not be retested soon. RSI at 59.92 gives it room; the MACD’s thin but positive histogram says momentum is building.
— Monday’s COMEX open is the battleground. If Brent holds above $75, the Strait of Hormuz remains threatened, and gold futures gap above $5,400 — the path to retesting $5,589 opens. For silver, $100 is the magnet. Dips toward $92–$93 (Tenkan-sen) are buying opportunities in the structural bull. The war changes everything — and precious metals are proving, again, that in a real crisis, there is no substitute for physical hard assets.
\n
\n
Related coverage: Brazil’s Ibovespa | Brazil’s Morning Call
Key Facts
— Deep Dive
— For the complete picture, read our in-depth guide: Iran War and Hormuz Crisis 2026: Oil, Latin America and the Global Fallout
This article was produced by The Rio Times’ automated newsroom system. How we use AI · Report an error · Editorial responsibility: Matthias Camenzind, Editor-in-Chief
Read More from The Rio Times