IBOV 167,674.89 ▼ 0.12% IPSA 11,003.17 ▼ 1.13% IPC MEX 65,860.95 ▲ 0.45% MERVAL 3,027,068 ▲ 0.15% COLCAP 2,429.93 ▲ 0.27% BVL PERÚ 58,737.38 ▲ 0.28% USD/BRL5.16▼ 0.05% USD/MXN17.06▼ 0.20% USD/CLP914.21▲ 0.06% USD/COP3,134▼ 0.16% USD/PEN3.36▼ 0.62% USD/ARS1,492▲ 0.07% USD/UYU40.27▲ 1.24% USD/PYG5,939▲ 1.68% USD/BOB11.64▼ 0.76% USD/DOP58.34▲ 1.25% USD/CRC445.92▲ 0.89% USD/GTQ7.62▲ 2.21% USD/HNL26.79▲ 1.57% USD/NIO36.62▲ 0.69% USD/VES762.44▼ 0.13% USD/PAB1.00— 0.00% USD/BZD2.00— 0.00% USD/JMD 157.29 — 0.00% USD/TTD6.70▲ 0.61% EUR/BRL5.95▲ 1.00% BRENT 88.81 ▼ 0.11% WTI 83.25 ▲ 0.06% IRON ORE 161.91 — — COPPER 6.63 ▲ 0.30% GOLD 4,486 ▲ 2.35% SILVER 65.88 ▲ 1.71% SOY 1,179 ▲ 2.75% CORN 473.50 ▲ 8.41% WHEAT 650.50 ▲ 3.21% COFFEE 320.10 ▼ 4.66% SUGAR 16.61 ▼ 0.72% ORANGE JUICE 137.95 ▼ 0.90% COTTON 85.03 ▲ 2.33% COCOA 5,748 ▲ 3.70% BEEF 224.18 ▼ 3.68% CATTLE 339.65 ▼ 3.01% LITHIUM 75.28 ▲ 1.58% PETR4 41.63 ▼ 0.07% VALE3 73.25 ▲ 1.22% ITUB4 38.67 ▼ 0.85% BBDC4 16.82 ▲ 0.18% ABEV3 14.91 ▼ 0.67% BBAS3 19.31 ▲ 0.16% B3SA3 14.20 ▼ 0.63% WEGE3 47.61 ▲ 0.53% PRIO3 59.13 ▼ 0.20% SUZB3 41.28 ▲ 2.23% RENT3 34.61 ▼ 0.29% AZZA3 15.88 ▼ 2.70% CSAN3 3.24 ▼ 1.22% RAIZ4 0.25 — 0.00% PCAR3 2.78 ▲ 0.72% GMAT3 3.63 ▼ 1.63% PSSA3 48.29 ▼ 0.21% CVCB3 1.30 ▼ 5.11% POSI3 3.36 ▲ 2.44% SLCE3 13.29 ▼ 0.08% NATU3 8.16 ▼ 0.49% BRKM5 5.70 ▲ 1.06% RANI3 7.97 ▲ 0.89% CSNA3 4.39 ▲ 2.57% CMIN3 5.56 ▼ 0.18% USIM5 6.57 ▼ 0.76% GGBR4 24.55 ▲ 1.61% ENEV3 24.17 ▼ 1.55% CPFE3 43.38 ▼ 0.62% CMIG4 10.38 ▼ 0.19% EQTL3 35.53 ▼ 0.78% LREN3 11.99 ▼ 0.33% VIVT3 29.96 ▼ 0.60% RAIL3 13.08 ▲ 0.93% KLABIN 17.71 ▲ 0.91% RAIA DROGASIL 17.95 ▼ 1.81% RDOR3 32.39 ▼ 2.35% HAPV3 9.60 ▼ 1.94% FLRY3 18.29 ▲ 0.55% SMTO3 14.55 ▼ 3.06% UGPA3 30.64 ▼ 1.13% VBBR3 33.21 ▼ 0.06% BBSE3 37.46 ▲ 0.54% BPAC11 50.11 ▼ 0.04% CURY3 31.18 ▼ 1.02% AERI3 2.18 ▼ 3.54% VIVARA 21.08 ▲ 0.91% COMPASS 21.62 ▼ 0.51% VAMOS 2.81 ▲ 0.36% SANB11 29.45 ▼ 0.24% ASAI3 8.08 — 0.00% SBSP3 26.06 ▲ 0.27% WALMEX 48.50 ▲ 0.27% GMEXICO 223.55 ▲ 0.47% FEMSA 200.89 ▼ 0.39% CEMEX 19.11 ▼ 0.21% GFNORTE 194.07 ▲ 1.23% BIMBO 60.88 ▼ 1.12% TELEVISA 9.69 — 0.00% AMX 19.79 ▼ 1.00% GAP 364.70 ▲ 0.01% ASUR 273.06 ▲ 0.52% OMA 232.58 ▲ 0.22% KOF 186.99 ▲ 0.30% GRUMA 251.87 ▼ 0.29% KIMBER 39.64 ▲ 0.18% SQM-B 65,250 ▼ 0.93% COPEC 5,990 ▼ 0.66% BSANTANDER 79.21 ▼ 1.23% FALABELLA 6,346 ▼ 1.29% ENELAM 87.11 ▲ 0.13% CENCOSUD 1,951 ▼ 1.95% CMPC 1,022 ▼ 1.73% BANCO CHILE 185.32 ▼ 0.82% LATAM AIR 23.98 ▼ 1.52% YPF 7,690 ▼ 1.28% GGAL 6,930 ▼ 1.49% PAMPA 5,040 ▼ 0.79% TXAR 745.00 ▼ 2.68% ALUAR 941.00 ▼ 0.90% TGS 8,770 ▼ 1.29% CEPU 2,140 ▲ 1.09% MIRGOR 1,650 ▼ 1.20% COME 40.94 ▼ 0.70% LOMA NEGRA 3,158 ▲ 0.96% BYMA 274.50 ▼ 1.88% TELECOM ARG 4,233 ▼ 0.70% ECOPETROL 16.90 ▼ 0.65% BANCOLOMBIA 96.86 ▼ 1.17% GRUPO AVAL 5.40 ▲ 2.66% CREDICORP 373.66 ▼ 0.89% SOUTHERN COPPER 193.52 ▼ 0.50% BUENAVENTURA 34.60 ▼ 0.59% MERCADOLIBRE 1,881 ▼ 3.04% NUBANK 13.48 ▼ 1.28% XP 15.51 — 0.00% PAGSEGURO 8.70 ▼ 2.19% STONE 9.86 ▼ 1.00% GLOBANT 38.01 ▼ 2.49% TECNOGLASS 42.22 ▼ 1.29% GAP AIRPORT 213.90 ▲ 0.15% ASUR 273.06 ▲ 0.52% OMA AIRPORT 108.67 ▲ 0.25% AMX ADR 23.18 ▼ 1.07% FEMSA ADR 117.48 ▼ 0.63% CEMEX ADR 11.18 ▼ 0.09% PETROBRAS ADR 17.95 ▲ 0.11% VALE ADR 14.52 ▲ 1.36% ITAU ADR 7.48 ▼ 0.27% SANTANDER BR 5.75 — 0.00% AMBEV ADR 2.85 ▲ 0.18% CSN 0.88 ▲ 1.32% GERDAU 4.80 ▲ 2.35% LATAM ADR 52.54 ▼ 0.89% BTC 63,472 ▼ 0.13% ETH 1,891 ▲ 0.54% SOL 75.63 ▼ 0.74% XRP 1.01 ▼ 1.18% BNB 610.08 ▼ 1.04% ADA 0.18 ▼ 2.70% DOGE 0.07 ▼ 1.38% AVAX 6.36 ▲ 0.60% LINK 8.74 ▼ 0.34% DOT 0.79 ▼ 0.40% LTC 45.06 ▼ 0.89% BCH 213.39 ▼ 0.12% TRX 0.34 ▲ 0.25% XLM 0.16 ▼ 1.82% HBAR 0.07 ▼ 0.70% NEAR 1.63 ▲ 1.17% ATOM 1.40 ▼ 2.29% AAVE 89.20 ▲ 1.09% SELIC 14.00% EMBRAER 95.59 ▲ 3.36% EMBRAER ADR 74.06 ▲ 3.74% JBS 13.09 ▲ 0.54% JBS BDR 67.48 ▲ 0.67% MBRF3 16.64 ▲ 2.97% MBRFY 3.14 ▲ 5.72% INTER 5.10 ▼ 1.92% EGX 55,040 ▲ 0.38% USD/ZAR16.15▼ 0.35% USD/NGN1,359▼ 0.29% NIKKEI 67,524 ▲ 0.83% CSI300 4,691 ▲ 0.58% HSI 25,440 ▼ 0.83% NIFTY 24,436 ▼ 0.15% KOSPI 6,579 ▲ 3.68% JCI 6,374 ▲ 1.69% USD/JPY159.42▲ 0.09% USD/CNY6.73▼ 0.19% DAX 26,331 ▼ 0.23% CAC 8,675 ▼ 0.46% FTSE 10,833 ▼ 0.10% MIB 53,699 ▼ 0.01% IBEX 20,204 ▼ 0.05% STOXX 659.48 ▼ 0.16% EUR/USD1.15▼ 0.10% GBP/USD1.35▼ 0.11% SPX 7,746 ▲ 0.23% DJI 53,831 ▲ 0.07% NDX 29,754 ▲ 0.77% RUT 3,043 ▲ 0.54% TSX 36,614 ▲ 0.38% VIX 14.79 ▼ 3.21% USD/CAD1.39▲ 0.12% US10Y 4.6700 ▼ 0.30% IBOV 167,674.89 ▼ 0.12% IPSA 11,003.17 ▼ 1.13% IPC MEX 65,860.95 ▲ 0.45% MERVAL 3,027,068 ▲ 0.15% COLCAP 2,429.93 ▲ 0.27% BVL PERÚ 58,737.38 ▲ 0.28% USD/BRL 5.16 ▼ 0.03% USD/MXN 17.06 ▼ 0.19% USD/CLP 912.82 ▼ 0.09% USD/COP 3,133 ▼ 0.22% USD/PEN 3.36 ▼ 0.60% USD/ARS 1,494 ▲ 0.17% USD/UYU 40.27 ▲ 1.24% USD/PYG 5,939 ▲ 1.68% USD/BOB 11.64 ▼ 0.76% USD/DOP 58.34 ▲ 1.25% USD/CRC 445.92 ▲ 0.89% USD/GTQ 7.62 ▲ 2.21% USD/HNL 26.79 ▲ 1.57% USD/NIO 36.62 ▲ 0.69% USD/VES 762.44 ▼ 0.13% USD/PAB 1.00 — 0.00% USD/BZD 2.00 — 0.00% USD/JMD 157.29 — 0.00% USD/TTD 6.70 ▲ 0.61% EUR/BRL 5.95 ▲ 1.03% BRENT 88.81 ▼ 0.11% WTI 83.25 ▲ 0.06% IRON ORE 161.91 — — COPPER 6.63 ▲ 0.30% GOLD 4,486 ▲ 2.35% SILVER 65.88 ▲ 1.71% SOY 1,179 ▲ 2.75% CORN 473.50 ▲ 8.41% WHEAT 650.50 ▲ 3.21% COFFEE 320.10 ▼ 4.66% SUGAR 16.61 ▼ 0.72% ORANGE JUICE 137.95 ▼ 0.90% COTTON 85.03 ▲ 2.33% COCOA 5,748 ▲ 3.70% BEEF 224.18 ▼ 3.68% CATTLE 339.65 ▼ 3.01% LITHIUM 75.28 ▲ 1.58% PETR4 41.63 ▼ 0.07% VALE3 73.25 ▲ 1.22% ITUB4 38.67 ▼ 0.85% BBDC4 16.82 ▲ 0.18% ABEV3 14.91 ▼ 0.67% BBAS3 19.31 ▲ 0.16% B3SA3 14.20 ▼ 0.63% WEGE3 47.61 ▲ 0.53% PRIO3 59.13 ▼ 0.20% SUZB3 41.28 ▲ 2.23% RENT3 34.61 ▼ 0.29% AZZA3 15.88 ▼ 2.70% CSAN3 3.24 ▼ 1.22% RAIZ4 0.25 — 0.00% PCAR3 2.78 ▲ 0.72% GMAT3 3.63 ▼ 1.63% PSSA3 48.29 ▼ 0.21% CVCB3 1.30 ▼ 5.11% POSI3 3.36 ▲ 2.44% SLCE3 13.29 ▼ 0.08% NATU3 8.16 ▼ 0.49% BRKM5 5.70 ▲ 1.06% RANI3 7.97 ▲ 0.89% CSNA3 4.39 ▲ 2.57% CMIN3 5.56 ▼ 0.18% USIM5 6.57 ▼ 0.76% GGBR4 24.55 ▲ 1.61% ENEV3 24.17 ▼ 1.55% CPFE3 43.38 ▼ 0.62% CMIG4 10.38 ▼ 0.19% EQTL3 35.53 ▼ 0.78% LREN3 11.99 ▼ 0.33% VIVT3 29.96 ▼ 0.60% RAIL3 13.08 ▲ 0.93% KLABIN 17.71 ▲ 0.91% RAIA DROGASIL 17.95 ▼ 1.81% RDOR3 32.39 ▼ 2.35% HAPV3 9.60 ▼ 1.94% FLRY3 18.29 ▲ 0.55% SMTO3 14.55 ▼ 3.06% UGPA3 30.64 ▼ 1.13% VBBR3 33.21 ▼ 0.06% BBSE3 37.46 ▲ 0.54% BPAC11 50.11 ▼ 0.04% CURY3 31.18 ▼ 1.02% AERI3 2.18 ▼ 3.54% VIVARA 21.08 ▲ 0.91% COMPASS 21.62 ▼ 0.51% VAMOS 2.81 ▲ 0.36% SANB11 29.45 ▼ 0.24% ASAI3 8.08 — 0.00% SBSP3 26.06 ▲ 0.27% WALMEX 48.50 ▲ 0.27% GMEXICO 223.55 ▲ 0.47% FEMSA 200.89 ▼ 0.39% CEMEX 19.11 ▼ 0.21% GFNORTE 194.07 ▲ 1.23% BIMBO 60.88 ▼ 1.12% TELEVISA 9.69 — 0.00% AMX 19.79 ▼ 1.00% GAP 364.70 ▲ 0.01% ASUR 273.06 ▲ 0.52% OMA 232.58 ▲ 0.22% KOF 186.99 ▲ 0.30% GRUMA 251.87 ▼ 0.29% KIMBER 39.64 ▲ 0.18% SQM-B 65,250 ▼ 0.93% COPEC 5,990 ▼ 0.66% BSANTANDER 79.21 ▼ 1.23% FALABELLA 6,346 ▼ 1.29% ENELAM 87.11 ▲ 0.13% CENCOSUD 1,951 ▼ 1.95% CMPC 1,022 ▼ 1.73% BANCO CHILE 185.32 ▼ 0.82% LATAM AIR 23.98 ▼ 1.52% YPF 7,690 ▼ 1.28% GGAL 6,930 ▼ 1.49% PAMPA 5,040 ▼ 0.79% TXAR 745.00 ▼ 2.68% ALUAR 941.00 ▼ 0.90% TGS 8,770 ▼ 1.29% CEPU 2,140 ▲ 1.09% MIRGOR 1,650 ▼ 1.20% COME 40.94 ▼ 0.70% LOMA NEGRA 3,158 ▲ 0.96% BYMA 274.50 ▼ 1.88% TELECOM ARG 4,233 ▼ 0.70% ECOPETROL 16.90 ▼ 0.65% BANCOLOMBIA 96.86 ▼ 1.17% GRUPO AVAL 5.40 ▲ 2.66% CREDICORP 373.66 ▼ 0.89% SOUTHERN COPPER 193.52 ▼ 0.50% BUENAVENTURA 34.60 ▼ 0.59% MERCADOLIBRE 1,881 ▼ 3.04% NUBANK 13.48 ▼ 1.28% XP 15.51 — 0.00% PAGSEGURO 8.70 ▼ 2.19% STONE 9.86 ▼ 1.00% GLOBANT 38.01 ▼ 2.49% TECNOGLASS 42.22 ▼ 1.29% GAP AIRPORT 213.90 ▲ 0.15% ASUR 273.06 ▲ 0.52% OMA AIRPORT 108.67 ▲ 0.25% AMX ADR 23.18 ▼ 1.07% FEMSA ADR 117.48 ▼ 0.63% CEMEX ADR 11.18 ▼ 0.09% PETROBRAS ADR 17.95 ▲ 0.11% VALE ADR 14.52 ▲ 1.36% ITAU ADR 7.48 ▼ 0.27% SANTANDER BR 5.75 — 0.00% AMBEV ADR 2.85 ▲ 0.18% CSN 0.88 ▲ 1.32% GERDAU 4.80 ▲ 2.35% LATAM ADR 52.54 ▼ 0.89% BTC 63,472 ▼ 0.13% ETH 1,891 ▲ 0.54% SOL 75.63 ▼ 0.74% XRP 1.01 ▼ 1.18% BNB 610.08 ▼ 1.04% ADA 0.18 ▼ 2.70% DOGE 0.07 ▼ 1.38% AVAX 6.36 ▲ 0.60% LINK 8.74 ▼ 0.34% DOT 0.79 ▼ 0.40% LTC 45.06 ▼ 0.89% BCH 213.39 ▼ 0.12% TRX 0.34 ▲ 0.25% XLM 0.16 ▼ 1.82% HBAR 0.07 ▼ 0.70% NEAR 1.63 ▲ 1.17% ATOM 1.40 ▼ 2.29% AAVE 89.20 ▲ 1.09% SELIC 14.00% EMBRAER 95.59 ▲ 3.36% EMBRAER ADR 74.06 ▲ 3.74% JBS 13.09 ▲ 0.54% JBS BDR 67.48 ▲ 0.67% MBRF3 16.64 ▲ 2.97% MBRFY 3.14 ▲ 5.72% INTER 5.10 ▼ 1.92% EGX 55,040 ▲ 0.38% USD/ZAR 16.15 ▼ 0.34% USD/NGN 1,359 ▼ 0.08% NIKKEI 67,524 ▲ 0.83% CSI300 4,691 ▲ 0.58% HSI 25,440 ▼ 0.83% NIFTY 24,436 ▼ 0.15% KOSPI 6,579 ▲ 3.68% JCI 6,374 ▲ 1.69% USD/JPY 159.35 ▲ 0.05% USD/CNY 6.7322 ▼ 0.06% DAX 26,331 ▼ 0.23% CAC 8,675 ▼ 0.46% FTSE 10,833 ▼ 0.10% MIB 53,699 ▼ 0.01% IBEX 20,204 ▼ 0.05% STOXX 659.48 ▼ 0.16% EUR/USD 1.1533 ▼ 0.11% GBP/USD 1.3501 ▼ 0.02% SPX 7,746 ▲ 0.23% DJI 53,831 ▲ 0.07% NDX 29,754 ▲ 0.77% RUT 3,043 ▲ 0.54% TSX 36,614 ▲ 0.38% VIX 14.79 ▼ 3.21% USD/CAD 1.3937 ▲ 0.09% US10Y 4.6700 ▼ 0.30%
since 2009
Wednesday, August 12, 2026

Brazil Economy

Brazil Has Cleared 110 Million Hectares of Native Vegetation in 40 Years

By · August 12, 2026 · 6 min read

Daily Brief

The morning intel from across Latin America. Free.

By subscribing you agree to our privacy policy. We never share your email.

Brazil · Environment

Key Facts

  • The finding Brazil lost 110 million hectares of native vegetation between 1985 and 2025, MapBiomas reported on August 12.
  • The shift Native vegetation fell from 79% of Brazil’s territory to 65% over those 41 years.
  • The cause Farmland and pasture expanded from 18% of the country to 32%.
  • Hardest hit The Amazon lost 53.9 million hectares and the Cerrado 51.7 million.
  • The warning MapBiomas says the loss leaves Brazil more exposed to climate extremes, including El Niño.

A sweeping new survey of the country from space shows farms and pasture steadily replacing forest and savanna. And warns the trade-off is making Brazil more fragile.

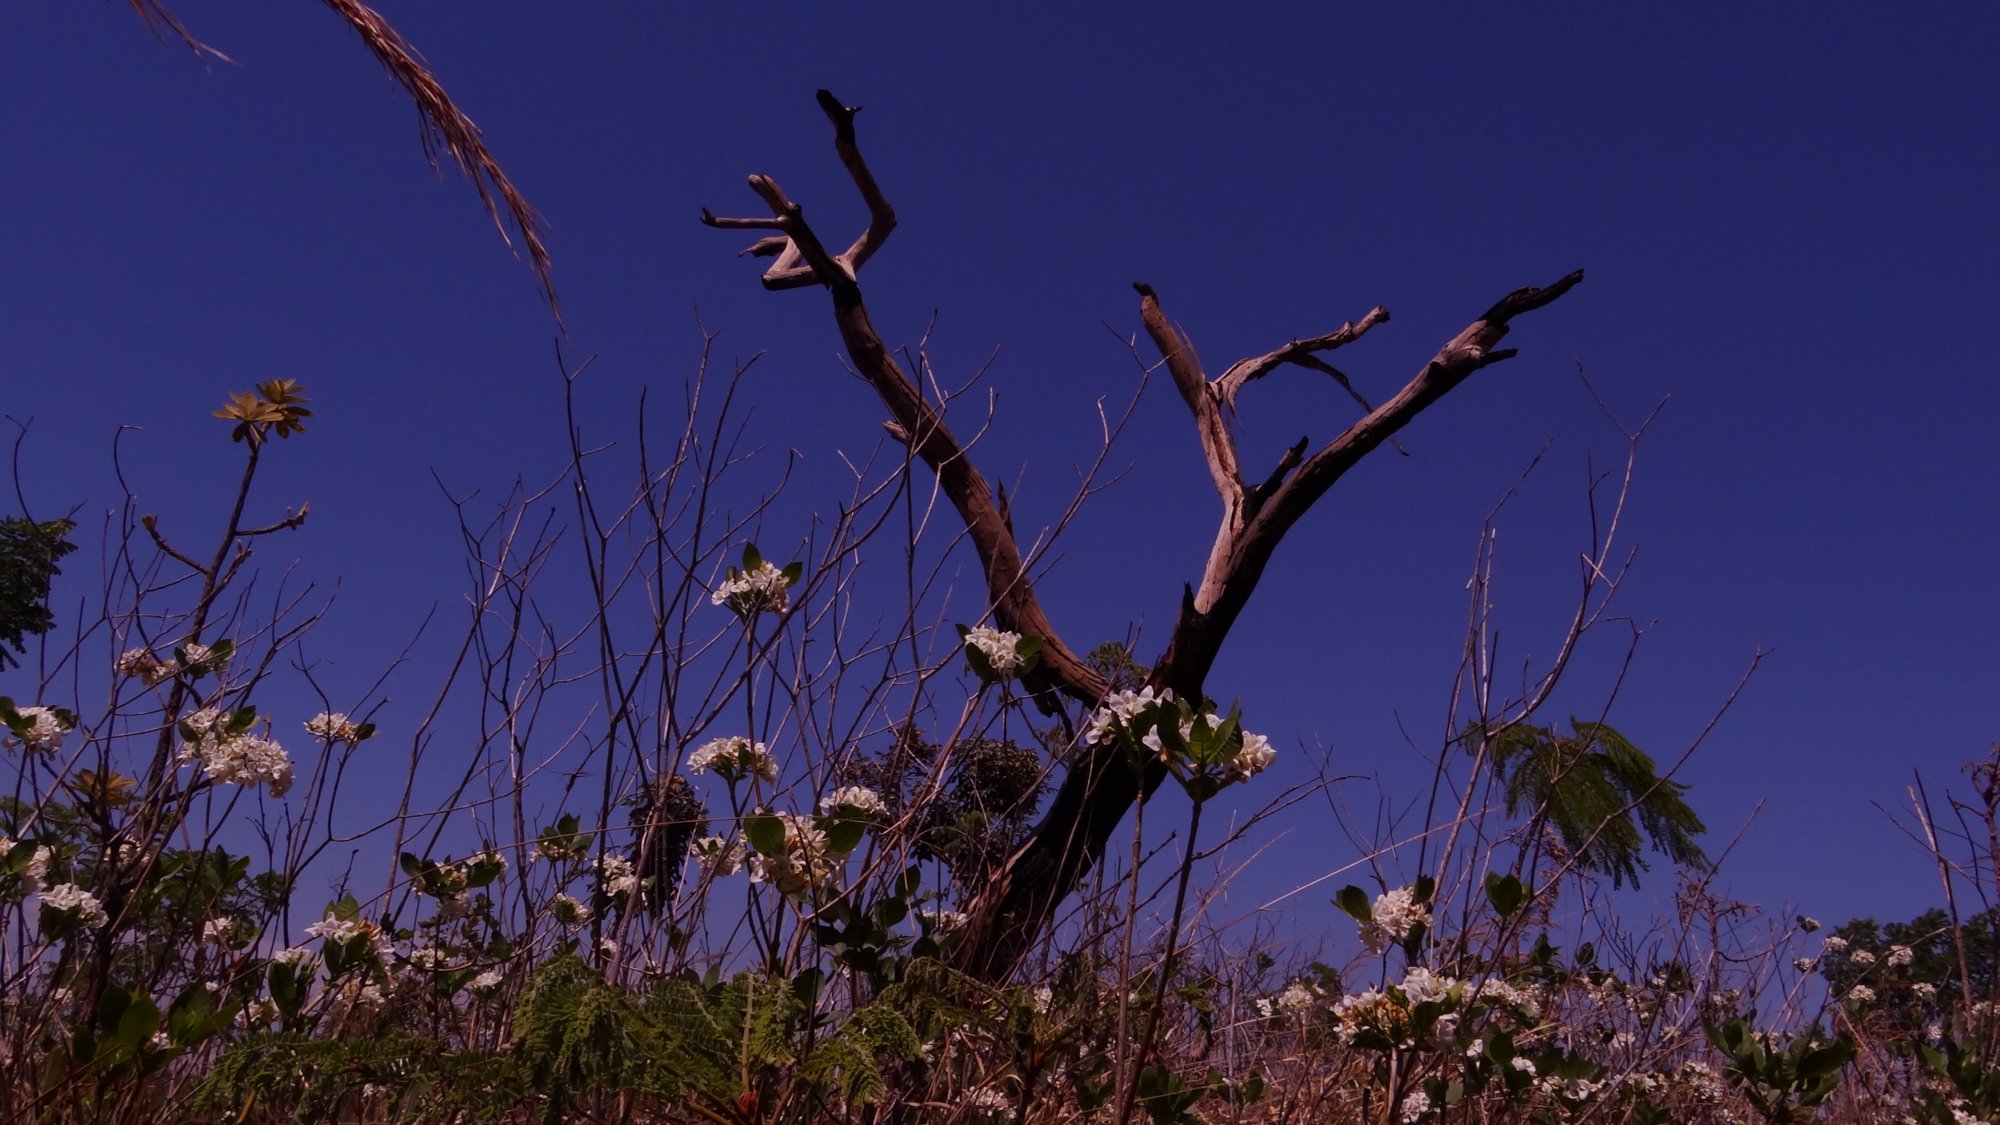
native vegetation — flowering plants of the Brazilian Cerrado savanna
Flowers of the Brazilian Cerrado, one of the hardest-hit biomes. MapBiomas says Brazil lost 110 million hectares of native vegetation between 1985 and 2025. (Photo: Jânio Muniz, CC BY-SA 4.0, Wikimedia Commons.)
One-stop reference
Company Intelligence
Every listed company in Latin America — financials, ownership and structure for 1,450+ companies across 26 exchanges, in one place.
Browse the directory →
RT
Ask Rio Times
Latin American markets, currencies and companies.
Open the full Ask Rio Times →

The picture they have assembled is stark: since 1985, the country has lost 110 million hectares of native vegetation. For 41 years, satellites have watched Brazil change from above.

That is forest, savanna and wetland, most of it turned into farmland and pasture.

Four decades of native vegetation, mapped from space

The findings come from MapBiomas, a respected network of universities, NGOs and tech companies that tracks land use from space. Its new Collection 11, released on August 12, stitches together four decades of satellite images into a single, searchable story.

The headline is a slow-motion transformation. Where native vegetation once covered 79% of Brazil, it now covers 65%.

What 110 million hectares really means

The number is hard to picture, so try this. The lost area is larger than many countries put together.

It did not vanish overnight. It slipped away steadily, a patch at a time, across a generation of clearing.

And it went somewhere specific. Almost all of it became land for crops and cattle.

Only about a third of the country now grows crops or grazes cattle. The rest is a patchwork of forest, savanna, wetland and city.

The rise of farms and cattle

The mirror image of the loss is the growth of agriculture. Farmland and pasture expanded from 18% of Brazil’s territory to 32%.

In raw terms, the area given over to farming ballooned from about 18.6 million hectares to 66.5 million. This is the engine of Brazil’s rise as an agricultural superpower.

The same expansion that feeds the world also reshaped the map.

Where the losses were worst

Two biomes bore the brunt in sheer size. The Amazon lost 53.9 million hectares of native cover, the Cerrado 51.7 million.

But raw hectares can hide the deeper wounds. Measured against their own size, the Cerrado shrank by 34% and the grassy Pampa by 32%.

The Atlantic Forest tells the saddest tale. Centuries of settlement have left it with native vegetation on just 32% of its land.

Put another way, an area of native land the size of a large country was converted in a single working lifetime. The pace is what alarms researchers.

Why the Cerrado matters so much

The Cerrado rarely makes headlines, unlike the Amazon. Yet this vast tropical savanna is a quiet giant.

It shelters enormous biodiversity and acts as a natural water tank, feeding rivers that supply much of the country. That is why its steep decline unsettles scientists.

Losing the Cerrado is not just losing scenery; it is losing plumbing.

The climate bill comes due

MapBiomas frames the loss as more than an environmental tally. It is a growing risk to Brazil itself.

Native ecosystems help regulate the climate, hold soils in place and keep rainfall reliable. Strip them away, and that buffer weakens.

The report warns this leaves the country more exposed to climate extremes, including the droughts and floods that El Niño brings. Farmers, for their part, note that Brazil still keeps a larger share of native land than most farming nations.

Both things can be true at once.

The world is watching Brazil’s land

Brazil’s vegetation is not only a national concern. The Amazon alone stores vast amounts of carbon that affects the whole planet.

When it shrinks, that carbon risks entering the atmosphere. So a map of Brazilian land use is, in part, a map of global climate risk.

This is why foreign governments, scientists and companies track these numbers as closely as Brazilians do.

A tension without an easy answer

Here lies the hard part. Agriculture is central to Brazil’s economy, its exports and millions of livelihoods.

Nobody is seriously proposing to unwind that. The debate is about how much more native land should be converted, and how fast.

The satellite record turns that debate from opinion into evidence. It is difficult to argue with four decades of pictures.

Why buyers now read the satellites too

There is a hard commercial edge to all this. Big buyers increasingly want proof that beef, soy and timber are not tied to fresh clearing.

Europe, for one, is tightening rules that link market access to deforestation-free supply chains. That turns MapBiomas-style data into a business tool.

A farm’s location on the map can decide whether its produce reaches a premium market.

Why this survey carries weight

MapBiomas has become a reference point precisely because it is transparent. Its data is public, and its methods are open to scrutiny.

That makes its numbers hard to dismiss as activism. Governments, companies and investors increasingly treat them as a baseline.

For anyone tracking Brazil’s environmental risk, from banks to buyers, this collection is a document worth reading closely.

What to watch from here

The value of a 41-year record is that it sets a clear trend line. The question now is whether that line bends.

Deforestation rates rise and fall with policy, prices and enforcement. Each future collection will show which way Brazil chose.

For a country that is both an ecological treasure and a farming powerhouse, that choice may be the defining one. The next release will land in a year or two.

It will show whether recent pledges to slow clearing turned into real change on the ground.

Frequently Asked Questions

What is MapBiomas?

It is a Brazilian network of universities, NGOs and technology partners that maps land use from satellite images. Its data is public and widely cited.

How much native vegetation did Brazil lose?

About 110 million hectares between 1985 and 2025, with cover falling from 79% of the country’s territory to 65%.

What caused the loss?

Mainly the expansion of farming and cattle ranching, which grew from 18% of Brazil’s territory to 32% over the same period.

Which areas were hit hardest?

The Amazon and Cerrado lost the most in absolute terms, while the Cerrado and Pampa shrank most relative to their own size.

Why does this matter beyond nature?

Native ecosystems help stabilise climate, soils and rainfall. Their loss leaves Brazil more vulnerable to extremes like El Niño.

Sources: MapBiomas (Collection 11); Agência Brasil; O Globo.

This article was produced by The Rio Times’ automated newsroom system. How we use AI · Report an error

Read More from The Rio Times

The Rio Times · Power Map
See who really holds power in Latin America
Click to open the Power Map

Rotate for Best Experience

This report is optimized for landscape viewing. Rotate your phone for the full experience.