IBOV 185,147.15 ▼ 0.02% IPSA 11,315.26 ▼ 1.14% IPC MEX 64,866.61 ▼ 0.87% MERVAL 3,049,121 ▼ 0.29% COLCAP 2,544.56 ▲ 0.40% BVL PERÚ 59,978.22 ▼ 0.31% USD/BRL5.12▼ 0.03% USD/MXN16.90▲ 0.10% USD/CLP933.68— 0.00% USD/COP3,124▼ 1.12% USD/PEN3.35▼ 0.34% USD/ARS1,509▲ 0.01% USD/UYU40.24▲ 1.33% USD/PYG5,947▲ 1.88% USD/BOB12.40▲ 3.56% USD/DOP59.00▲ 0.85% USD/CRC448.67▲ 1.78% USD/GTQ7.63▲ 2.28% USD/HNL26.84▲ 0.28% USD/NIO36.62— 0.00% USD/VES805.37▼ 0.90% USD/PAB1.00— 0.00% USD/BZD2.00— 0.00% USD/JMD 157.28 — 0.00% USD/TTD6.71▲ 1.02% EUR/BRL5.95▲ 0.91% BRENT 88.88 ▼ 0.03% WTI 83.11 ▼ 0.11% IRON ORE 161.91 — — COPPER 6.61 ▲ 0.03% GOLD 4,461 ▲ 1.78% SILVER 65.59 ▲ 1.26% SOY 1,184 ▲ 3.20% CORN 480.50 ▲ 10.02% WHEAT 655.00 ▲ 3.93% COFFEE 317.25 ▼ 5.51% SUGAR 16.43 ▼ 1.79% ORANGE JUICE 138.55 ▼ 0.47% COTTON 85.03 ▲ 2.33% COCOA 5,719 ▲ 3.18% BEEF 223.60 ▼ 3.93% CATTLE 339.10 ▼ 3.16% LITHIUM 75.20 ▲ 1.47% PETR4 41.64 ▼ 0.05% VALE3 72.97 ▲ 0.83% ITUB4 38.60 ▼ 1.03% BBDC4 16.85 ▲ 0.36% ABEV3 14.89 ▼ 0.80% BBAS3 19.37 ▲ 0.47% B3SA3 14.26 ▼ 0.21% WEGE3 47.59 ▲ 0.49% PRIO3 59.14 ▼ 0.19% SUZB3 41.33 ▲ 2.35% RENT3 34.68 ▼ 0.09% AZZA3 15.89 ▼ 2.63% CSAN3 3.22 ▼ 1.83% RAIZ4 0.25 — 0.00% PCAR3 2.75 ▼ 0.36% GMAT3 3.65 ▼ 1.08% PSSA3 48.13 ▼ 0.54% CVCB3 1.33 ▼ 2.92% POSI3 3.36 ▲ 2.44% SLCE3 13.34 ▲ 0.30% NATU3 8.14 ▼ 0.73% IBOV 185,147.15 ▼ 0.02% IPSA 11,315.26 ▼ 1.14% IPC MEX 64,866.61 ▼ 0.87% MERVAL 3,049,121 ▼ 0.29% COLCAP 2,544.56 ▲ 0.40% BVL PERÚ 59,978.22 ▼ 0.31% USD/BRL 5.16 ▲ 0.01% USD/MXN 17.06 ▼ 0.24% USD/CLP 913.98 ▲ 0.04% USD/COP 3,140 ▲ 0.03% USD/PEN 3.36 ▼ 0.66% USD/ARS 1,493 ▲ 0.10% USD/UYU 40.27 ▲ 1.24% USD/PYG 5,939 ▲ 1.68% USD/BOB 11.64 ▼ 0.76% USD/DOP 58.34 ▲ 1.25% USD/CRC 445.92 ▲ 0.89% USD/GTQ 7.62 ▲ 2.21% USD/HNL 26.79 ▲ 1.57% USD/NIO 36.62 ▲ 0.69% USD/VES 762.44 ▼ 0.13% USD/PAB 1.00 — 0.00% USD/BZD 2.00 — 0.00% USD/JMD 157.28 — 0.00% USD/TTD 6.70 ▲ 0.61% EUR/BRL 5.95 ▲ 1.01% BRENT 88.88 ▼ 0.03% WTI 83.11 ▼ 0.11% IRON ORE 161.91 — — COPPER 6.61 ▲ 0.03% GOLD 4,461 ▲ 1.78% SILVER 65.59 ▲ 1.26% SOY 1,184 ▲ 3.20% CORN 480.50 ▲ 10.02% WHEAT 655.00 ▲ 3.93% COFFEE 317.25 ▼ 5.51% SUGAR 16.43 ▼ 1.79% ORANGE JUICE 138.55 ▼ 0.47% COTTON 85.03 ▲ 2.33% COCOA 5,719 ▲ 3.18% BEEF 223.60 ▼ 3.93% CATTLE 339.10 ▼ 3.16% LITHIUM 75.20 ▲ 1.47% PETR4 41.64 ▼ 0.05% VALE3 72.97 ▲ 0.83% ITUB4 38.60 ▼ 1.03% BBDC4 16.85 ▲ 0.36% ABEV3 14.89 ▼ 0.80% BBAS3 19.37 ▲ 0.47% B3SA3 14.26 ▼ 0.21% WEGE3 47.59 ▲ 0.49% PRIO3 59.14 ▼ 0.19% SUZB3 41.33 ▲ 2.35% RENT3 34.68 ▼ 0.09% AZZA3 15.89 ▼ 2.63% CSAN3 3.22 ▼ 1.83% RAIZ4 0.25 — 0.00% PCAR3 2.75 ▼ 0.36% GMAT3 3.65 ▼ 1.08% PSSA3 48.13 ▼ 0.54% CVCB3 1.33 ▼ 2.92% POSI3 3.36 ▲ 2.44% SLCE3 13.34 ▲ 0.30% NATU3 8.14 ▼ 0.73%
since 2009
Sunday, September 6, 2026

Brazil Adds 370K Formal Jobs in Two Months, But Pace Falls 38% From Last Year

By · April 1, 2026 · 2 min read

Daily Brief

The morning intel from across Latin America. Free.

By subscribing you agree to our privacy policy. We never share your email.

Key Facts

Brazil created 370,339 net formal jobs in January-February 2026, a 37.8% decline from 595,000 in the same period last year

February alone added 255,321 positions — down 42% year-over-year — as high interest rates and slowing GDP weigh on hiring

Total formal workforce reached 48.83 million, up 2.19% over the past 12 months, with all five major sectors posting positive balances

Brazil formal employment creation slowed sharply in the first two months of 2026, according to CAGED data published Tuesday by the Ministry of Labor. The economy added 370,339 net formal positions in January and February combined — a 37.8% drop from approximately 595,000 in the same period of 2025.

February accounted for 255,321 of those jobs, a significant improvement over January’s 115,018 but still 42% below February 2025’s 440,432. The deceleration reflects the cumulative drag of the Selic at 14.75% and GDP growth that slowed to just 0.1% quarter-over-quarter in Q4 2025.

Sector Breakdown

All five major economic sectors posted positive net job creation in February, but the distribution was uneven. Services dominated with 177,953 new positions, driven primarily by public administration, education, and health — sectors less sensitive to interest rate cycles.
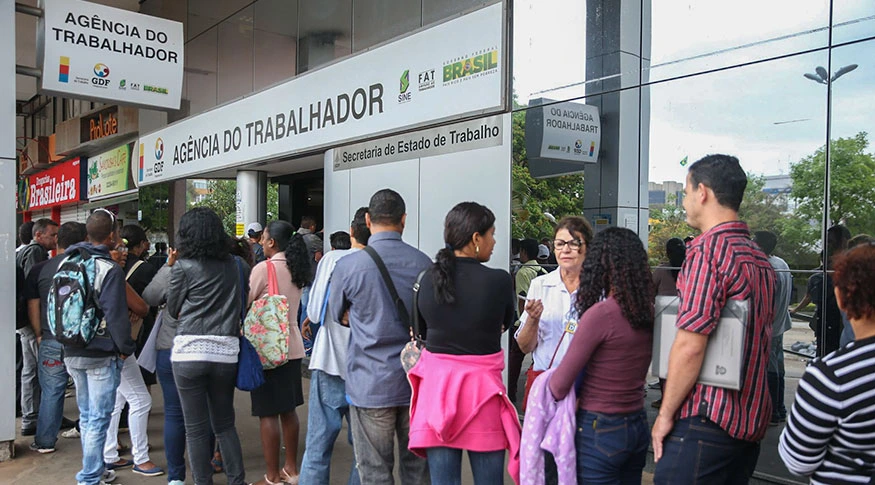
Brazil Adds 370K Formal Jobs in Two Months, But Pace Falls 38% From Last Year.
One-stop reference
Company Intelligence
Every listed company in Latin America — financials, ownership and structure for 1,450+ companies across 26 exchanges, in one place.
Browse the directory →
RT
Ask Rio Times
17 years of Latin America reporting, on demand.
Open the full Ask Rio Times →

Industry added 32,027 positions and construction contributed 31,099. Commerce, which typically contracts after the year-end holiday season, managed a modest 6,127 net gain. Agriculture posted 8,123 new positions.

The services sector’s outsized share — nearly 70% of February’s total — signals that job creation is increasingly concentrated in government-adjacent activities rather than private sector expansion. This aligns with Lula‘s 24,000 new public positions signed into law the same day.

The Selic Shadow

The year-over-year decline is the clearest labor market evidence yet that tight monetary policy is constraining the real economy. With the Selic at 14.75% and consumer credit costs rising, businesses face elevated borrowing costs that directly suppress hiring and investment decisions.

The Focus survey now expects only 150 basis points of Selic cuts in 2026 — half the 300bp anticipated before the Iran crisis. If the easing cycle remains slower than expected, the labor market deceleration will deepen in the months ahead.

Brazil’s total formal workforce stood at 48.83 million at the end of February, up 2.19% over the trailing twelve months. The labor market is still growing — but at a pace that is falling further behind the government’s fiscal and political ambitions in an election year.

This article was drafted with automated assistance and reviewed before publication. How we use AI · Report an error

Read More from The Rio Times

The Rio Times · Power Map
See who really holds power in Latin America
Click to open the Power Map

Rotate for Best Experience

This report is optimized for landscape viewing. Rotate your phone for the full experience.