Why Mexico’s Nearshoring Boom Is Cooling in the North
Key Facts
— — Cushman & Wakefield’s 2025 Industrial Labor Report finds Mexico industrial construction has entered a six-quarter rebalancing phase, with supply outpacing absorption and developers extending delivery timelines in border markets.
— — Mexico City now commands the country’s highest industrial wages at US$4.91 per hour for production and US$4.75 for warehouse roles — 35% above the national average — reflecting intensifying competition for technical and bilingual talent.
— — Ciudad Juárez and Reynosa are cooling as vacancy rises, while Querétaro, Guadalajara, and Tijuana maintain active pipelines focused on advanced manufacturing and export-oriented operations.
— Deep Dive
— For the complete picture, see our guide: Mexico Economy 2026.
Mexico industrial construction has entered a deliberate rebalancing phase after several years of explosive nearshoring-driven expansion, according to Cushman & Wakefield’s 2025 Industrial Labor Report. The gap between supply and demand has widened over the past six consecutive quarters, signaling a transition toward more equilibrium-oriented market conditions after the 43 million square feet of absorption recorded during the 2022 peak.
The Rio Times, the Latin American financial news outlet, reports that the shift reflects a labor market evolution that has moved beyond the initial nearshoring surge. Developers are extending delivery timelines and becoming selective about new projects, particularly in northern border markets where vacancy has increased materially.
The report arrives at a politically consequential moment. Formal USMCA renegotiation talks begin on May 25, 2026, and the review framework creates incremental uncertainty for long-lead industrial investments precisely when developers are already tightening capital allocation.
What the Mexico Industrial Construction Labor Cost Map Shows
Mexico City commands the highest industrial labor costs in the country at US$4.91 per hour for production roles and US$4.75 per hour for warehouse positions — 35% above the national average. The premium reflects both consolidated demand and the concentration of higher-value manufacturing activity in the central corridor.
Tijuana and Guadalajara are also registering sharp salary increases as competition for specialized workers intensifies. The Cushman & Wakefield framework identifies four structural forces reshaping the industrial labor market: rising demand for technical and bilingual talent, salary escalation in consolidated markets, regional cost differentials, and the concentration of operations in specialized hubs.
Monterrey and Querétaro anchor the technical-talent pole. Both cities host structured training programs and technical-profile concentrations supporting the automotive, logistics, and advanced manufacturing sectors that dominate northern and central Mexico nearshoring demand.
The Two-Speed Geography
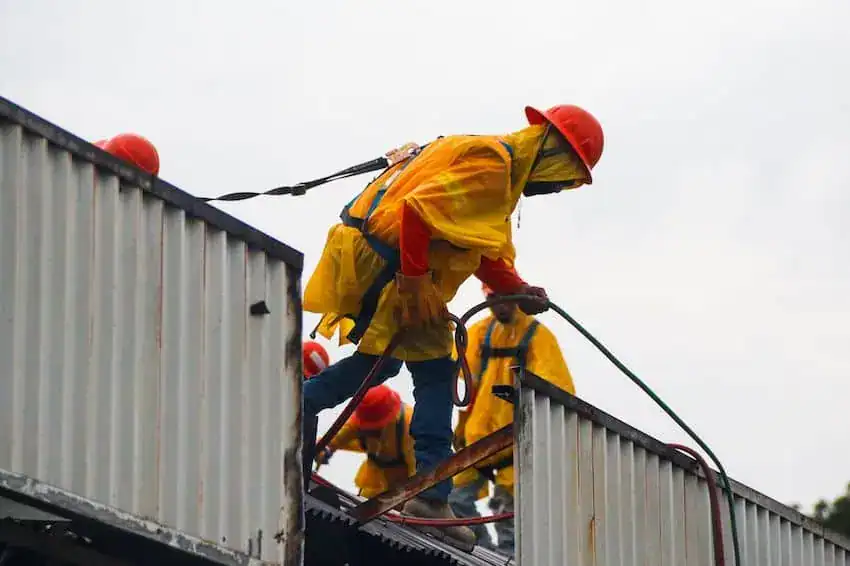
The rebalancing is not uniform across Mexican industrial corridors. Ciudad Juárez and Reynosa — the two markets where construction most aggressively outran absorption during the 2022-2024 cycle — now carry elevated vacancy. Developers are moderating new starts and extending existing delivery schedules rather than accelerating speculative builds.
Ciudad Juárez had been one of the standout performers only two quarters earlier. Third-quarter 2025 data showed a 63% surge in gross absorption driven by automotive, medical device, and electronics tenants. The Cushman & Wakefield report’s framing suggests that surge absorbed the overhang that prior quarterly builds had created, and the market is now normalizing rather than collapsing.
Querétaro, Guadalajara, and Tijuana carry active pipelines focused explicitly on advanced manufacturing and export-oriented production. Those three markets benefit from the combination of technical labor availability, supplier-network depth, and proximity to US-bound logistics corridors that speculative border builds cannot replicate.
Why Rebalancing Is Not a Slowdown
The report explicitly resists the narrative of a nearshoring pullback. Construction activity remains high, and absorption continues at volumes that would have defined a boom market in any pre-pandemic year. The distinction is that supply growth is now being disciplined by labor costs and talent availability rather than capital availability alone.
Northern Mexico industrial rents surged 39% in a single year during 2024, pushing some locations toward pricing levels comparable to Miami-equivalent US markets. That price signal has begun redirecting cost-sensitive investors toward secondary Mexican cities and, selectively, toward alternative regional locations in Central America and Colombia.
The rebalancing ultimately favors occupiers. The report concludes that the alignment between supply, demand, and labor capabilities is improving. Tenants face broader location options, more mature talent pipelines in secondary hubs, and developers willing to compete on specification rather than pure speed-to-market.
The USMCA Overlay
The timing is consequential. As Rio Times coverage of the USMCA May 25 renegotiation has documented, Mexican Economy Minister Marcelo Ebrard confirmed this week that formal USMCA review talks begin May 25, 2026. The joint review framework is expected to focus on rules of origin, Chinese-content disqualifications, and automotive content thresholds — all of which directly condition industrial location decisions.
The USMCA uncertainty is a rational driver of the current developer selectivity. Speculative border construction made sense when the nearshoring thesis was unchallenged; it makes less sense during a review period that could alter qualification thresholds for the cross-border trade that justifies the warehouses.
Tariff volatility adds a second friction. Mexico remains subject to 25% tariffs on non-T-MEC compliant goods, 25% on light vehicles, and 50% on steel, aluminum, and copper — conditions that reward established operators with compliant supply chains and penalize new entrants still optimizing their value-added framework.
The Macro Context
The rebalancing lands in a weakening Mexican macro environment. As Rio Times’s Mexico Economy 2026 Outlook has documented, the January IGAE index fell 0.9% month-on-month, industrial output contracted 1.1%, and manufacturing has declined for 35 consecutive months on an employment basis. BBVA Research projects 1.8% GDP growth for 2026 and Banxico holds rates steady while watching for US policy signals.
For the nearshoring pillar, the rebalancing framing is ultimately constructive. As Rio Times’s Nearshoring Mexico 2026 Complete Guide detailed, Monterrey ended Q3 2025 with 203 million square feet of industrial inventory and 28% quarter-over-quarter absorption growth. The Mexican industrial real estate cycle is maturing, not reversing.
What the Cushman & Wakefield report makes clear is that the next phase of Mexican industrial growth will be determined less by capital deployment speed and more by the availability of specialized, bilingual, digitally-capable technical talent. The cities that have invested in training infrastructure will capture the next tier of foreign direct investment; those that relied on speculative warehouse construction will see their 2022-2024 vintage inventory absorb slowly.
What to Watch
Three signals define the next two quarters. First, vacancy data for Ciudad Juárez and Reynosa in the Q2 2026 industrial market report. Further vacancy increases would suggest the rebalancing is deepening; stabilization would confirm the cycle has found its floor.
Second, the USMCA rules-of-origin framework that emerges from the May 25 formal negotiations. Tighter Chinese-content disqualifications would accelerate demand for qualified Mexican supply; looser thresholds would favor maintaining the existing distribution network.
Third, Banxico’s response to any Q2 inflation pass-through from the labor cost increases Cushman & Wakefield documented. Persistent wage pressure in Mexico City, Tijuana, and Guadalajara would constrain the rate-cutting cycle that Sheinbaum’s economic team has been waiting for through the first four months of 2026.
More: Latin America news in English, every day from The Rio Times.
This article was produced by The Rio Times’ automated newsroom system. How we use AI · Report an error · Editorial responsibility: Matthias Camenzind, Editor-in-Chief
In depth