Brazil’s B3’s May Metrics: A Mixed Bag of Declines and Strategic Gains
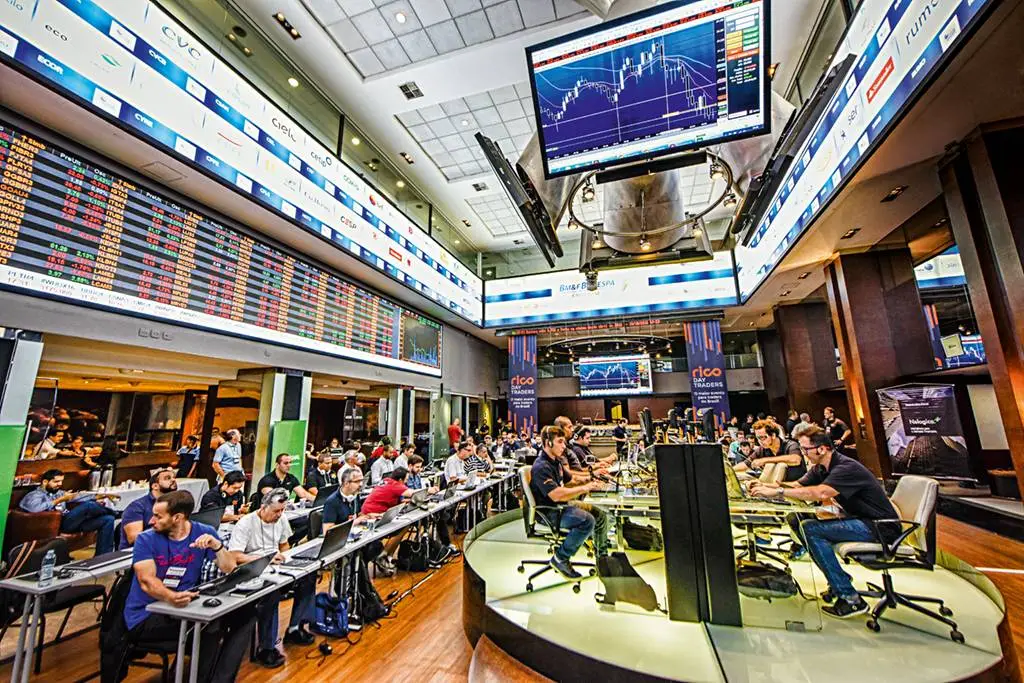
In May, B3, Brazil’s major stock exchange, navigated a complex landscape with mixed financial results.
Trading volumes dipped to R$24.7 billion ($4.57 billion), marking an 8.8% fall from last year and a 3.4% decrease from April.
Moreover, investor numbers slightly fell to 5.116 million, down 3.3% year-over-year. However, the derivatives market flourished.
Daily transactions hit 6.629 million, up 5.3% from last year, despite a sharp 33% drop since April.
Notably, equity derivatives surged, generating R$80 million ($14.81 million), up 36% from March and surpassing the previous April by 43%.
Similarly, non-equity derivatives saw a 30% increase from March, with revenues jumping 45% year-on-year.
B3’s assets under custody also climbed to R$17.3 billion ($3.20 billion), a 5% increase from March and 16% above the previous year.
The registration segment improved notably, rising 20% from March and outperforming last April by 23%.
Amidst these financial shifts, B3 took strategic steps to enhance its market position.
Vitru, a leader in online education, moved its listing from Nasdaq to B3, symbolized as VTRU3.
This transition aims to lure Brazilian firms back from U.S. markets, showcasing B3’s growing maturity and appeal.
Leonardo Resende, B3’s Superintendent of Corporate Relations, stressed the significance of these moves.
He asserted they demonstrate B3’s ability to support robust domestic activities and attract substantial investor interest.
These developments reflect broader economic trends and B3’s agility in adapting to a dynamic global financial environment.
Such shifts underscore the strategic role of national exchanges in influencing global economic policies and guiding investment decisions.
More: Brazil news in English, every day from The Rio Times.
Live Market IntelligenceBrazil — Live Market Board
Rio Times · Live Market Intelligence
Brazil — Live Market Board
+0.47%
205,082.56
+0.47%
69,879.62
-0.01%
10,746.36
-0.31%
3,017,221
—
2,540.10
+0.46%
57,021.19
+0.13%
| Instrument | Last | Change | YoY | Prev. | High | Low | Volume |
|---|---|---|---|---|---|---|---|
| IBOV | 205,082.56 | +0.47% | +21.85% | 204,120.12 | 168,310 | 167,142 | — |
| USD/BRL | 5.16 | +0.01% | -5.13% | 5.16 | 5.18 | 5.14 | — |
| SELIC | 14.00% | — | — | — | — | — | |
| PETR4 | 41.64 | -0.05% | +35.19% | 41.66 | 41.97 | 41.15 | 41,499,400 |
| VALE3 | 72.97 | +0.83% | +30.75% | 72.37 | 73.54 | 72.66 | 17,658,000 |
| ITUB4 | 38.60 | -1.03% | +4.57% | 39.00 | 39.34 | 38.39 | 29,487,800 |
| BBDC4 | 16.85 | +0.36% | +3.50% | 16.79 | 16.90 | 16.67 | 19,416,900 |
| BBAS3 | 19.37 | +0.47% | +0.73% | 19.28 | 19.44 | 19.16 | 11,069,200 |
| B3SA3 | 14.26 | -0.21% | +12.73% | 14.29 | 14.47 | 14.11 | 33,037,800 |
| ABEV3 | 14.89 | -0.80% | +21.91% | 15.01 | 15.07 | 14.81 | 16,453,100 |
| WEGE3 | 47.59 | +0.49% | +29.99% | 47.36 | 48.08 | 47.36 | 3,364,600 |
| PRIO3 | 59.14 | -0.19% | +50.67% | 59.25 | 59.81 | 58.74 | 3,325,600 |
| SUZB3 | 41.33 | +2.35% | -23.55% | 40.38 | 41.48 | 40.35 | 3,914,900 |
| RENT3 | 34.68 | -0.09% | +0.84% | 34.71 | 34.96 | 34.35 | 7,979,100 |
| AZZA3 | 15.89 | -2.63% | -53.76% | 16.32 | 16.42 | 15.82 | 1,330,300 |
| CSNA3 | 4.30 | +0.47% | -42.65% | 4.28 | 4.41 | 4.26 | 10,076,100 |
| GGBR4 | 24.69 | +2.19% | +51.38% | 24.16 | 24.85 | 24.18 | 7,047,600 |
| ENEV3 | 24.21 | -1.38% | +70.49% | 24.55 | 24.64 | 23.99 | 9,297,000 |
This article was produced by The Rio Times’ automated newsroom system. How we use AI · Report an error · Editorial responsibility: Matthias Camenzind, Editor-in-Chief
LatAm Markets: Live Signals → — real-time movers, turnover leaders and FX across Latin America.