IBOV 185,147.15 ▼ 0.02% IPSA 11,315.26 ▼ 1.14% IPC MEX 64,866.61 ▼ 0.87% MERVAL 3,049,121 ▼ 0.29% COLCAP 2,544.56 ▲ 0.40% BVL PERÚ 59,978.22 ▼ 0.31% USD/BRL5.12▼ 0.07% USD/MXN16.88▼ 0.04% USD/CLP933.68▼ 0.10% USD/COP3,124— 0.00% USD/PEN3.35▼ 0.02% USD/ARS1,509▼ 0.02% USD/UYU40.24— 0.00% USD/PYG5,947— 0.00% USD/BOB12.40— 0.00% USD/DOP59.00— 0.00% USD/CRC448.67— 0.00% USD/GTQ7.63— 0.00% USD/HNL26.84— 0.00% USD/NIO36.62— 0.00% USD/VES805.37▼ 0.90% USD/PAB1.00— 0.00% USD/BZD2.00— 0.00% USD/JMD 157.28 — 0.00% USD/TTD6.71— 0.00% EUR/BRL5.95▲ 0.91% BRENT 88.88 ▼ 0.03% WTI 83.11 ▼ 0.11% IRON ORE 161.91 — — COPPER 6.61 ▲ 0.03% GOLD 4,461 ▲ 1.78% SILVER 65.59 ▲ 1.26% SOY 1,184 ▲ 3.20% CORN 480.50 ▲ 10.02% WHEAT 655.00 ▲ 3.93% COFFEE 317.25 ▼ 5.51% SUGAR 16.43 ▼ 1.79% ORANGE JUICE 138.55 ▼ 0.47% COTTON 85.03 ▲ 2.33% COCOA 5,719 ▲ 3.18% BEEF 223.60 ▼ 3.93% CATTLE 339.10 ▼ 3.16% LITHIUM 75.20 ▲ 1.47% PETR4 41.64 ▼ 0.05% VALE3 72.97 ▲ 0.83% ITUB4 38.60 ▼ 1.03% BBDC4 16.85 ▲ 0.36% ABEV3 14.89 ▼ 0.80% BBAS3 19.37 ▲ 0.47% B3SA3 14.26 ▼ 0.21% WEGE3 47.59 ▲ 0.49% PRIO3 59.14 ▼ 0.19% SUZB3 41.33 ▲ 2.35% RENT3 34.68 ▼ 0.09% AZZA3 15.89 ▼ 2.63% CSAN3 3.22 ▼ 1.83% RAIZ4 0.25 — 0.00% PCAR3 2.75 ▼ 0.36% GMAT3 3.65 ▼ 1.08% PSSA3 48.13 ▼ 0.54% CVCB3 1.33 ▼ 2.92% POSI3 3.36 ▲ 2.44% SLCE3 13.34 ▲ 0.30% NATU3 8.14 ▼ 0.73% IBOV 185,147.15 ▼ 0.02% IPSA 11,315.26 ▼ 1.14% IPC MEX 64,866.61 ▼ 0.87% MERVAL 3,049,121 ▼ 0.29% COLCAP 2,544.56 ▲ 0.40% BVL PERÚ 59,978.22 ▼ 0.31% USD/BRL 5.16 ▲ 0.01% USD/MXN 17.06 ▼ 0.24% USD/CLP 913.98 ▲ 0.04% USD/COP 3,140 ▲ 0.03% USD/PEN 3.36 ▼ 0.66% USD/ARS 1,493 ▲ 0.10% USD/UYU 40.27 ▲ 1.24% USD/PYG 5,939 ▲ 1.68% USD/BOB 11.64 ▼ 0.76% USD/DOP 58.34 ▲ 1.25% USD/CRC 445.92 ▲ 0.89% USD/GTQ 7.62 ▲ 2.21% USD/HNL 26.79 ▲ 1.57% USD/NIO 36.62 ▲ 0.69% USD/VES 762.44 ▼ 0.13% USD/PAB 1.00 — 0.00% USD/BZD 2.00 — 0.00% USD/JMD 157.28 — 0.00% USD/TTD 6.70 ▲ 0.61% EUR/BRL 5.95 ▲ 1.01% BRENT 88.88 ▼ 0.03% WTI 83.11 ▼ 0.11% IRON ORE 161.91 — — COPPER 6.61 ▲ 0.03% GOLD 4,461 ▲ 1.78% SILVER 65.59 ▲ 1.26% SOY 1,184 ▲ 3.20% CORN 480.50 ▲ 10.02% WHEAT 655.00 ▲ 3.93% COFFEE 317.25 ▼ 5.51% SUGAR 16.43 ▼ 1.79% ORANGE JUICE 138.55 ▼ 0.47% COTTON 85.03 ▲ 2.33% COCOA 5,719 ▲ 3.18% BEEF 223.60 ▼ 3.93% CATTLE 339.10 ▼ 3.16% LITHIUM 75.20 ▲ 1.47% PETR4 41.64 ▼ 0.05% VALE3 72.97 ▲ 0.83% ITUB4 38.60 ▼ 1.03% BBDC4 16.85 ▲ 0.36% ABEV3 14.89 ▼ 0.80% BBAS3 19.37 ▲ 0.47% B3SA3 14.26 ▼ 0.21% WEGE3 47.59 ▲ 0.49% PRIO3 59.14 ▼ 0.19% SUZB3 41.33 ▲ 2.35% RENT3 34.68 ▼ 0.09% AZZA3 15.89 ▼ 2.63% CSAN3 3.22 ▼ 1.83% RAIZ4 0.25 — 0.00% PCAR3 2.75 ▼ 0.36% GMAT3 3.65 ▼ 1.08% PSSA3 48.13 ▼ 0.54% CVCB3 1.33 ▼ 2.92% POSI3 3.36 ▲ 2.44% SLCE3 13.34 ▲ 0.30% NATU3 8.14 ▼ 0.73%
since 2009
Sunday, September 6, 2026

Boa Safra Reports Sharp Profit Decline While Accelerating Expansion Plans

By · March 26, 2025 · 2 min read

Daily Brief

The morning intel from across Latin America. Free.

By subscribing you agree to our privacy policy. We never share your email.

Brazilian seed producer Boa Safra (SOJA3) reported a 62.68% plunge in fourth-quarter profit to R$80.263 million ($14.08 million), according to recent financial results.

The significant decline contrasts with the R$215.057 million ($37.73 million) earned in the same period of 2023, highlighting severe challenges faced by Brazil’s agricultural sector throughout 2024.

Annual profit showed a similar downward trend, falling 53.47% to R$160.508 million ($28.16 million) from R$344.952 million ($60.52 million) in 2023. The company’s EBITDA also contracted by 20.09% year-over-year in Q4 to R$103.158 million ($18.1 million) and declined 34.55% for the full year.

Despite these profit setbacks, Boa Safra achieved revenue growth. Net operating revenue increased 13.78% to R$956 million ($167.72 million) in Q4 2024 compared to the same period last year.

Management attributed the profit decline to weather extremes that directly affected seed production volumes. The company faced multiple challenges during 2024. Drought conditions during planting followed by intense rainfall during harvest significantly disrupted operations.
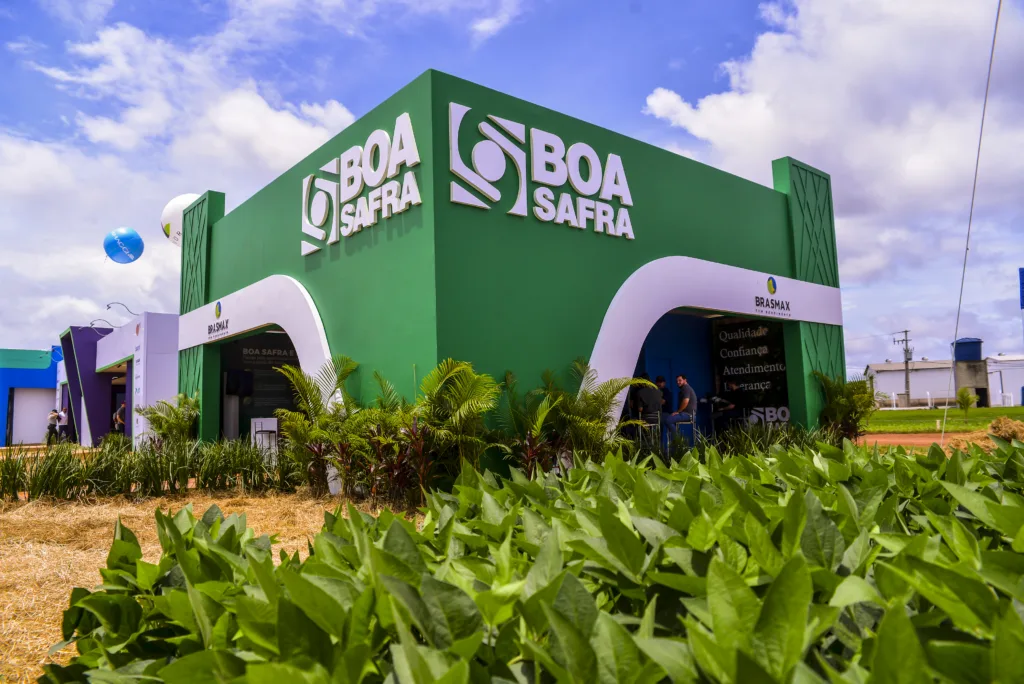
Boa Safra Reports Sharp Profit Decline While Accelerating Expansion Plans
Boa Safra Reports Sharp Profit Decline While Accelerating Expansion Plans.
One-stop reference
Company Intelligence
Every listed company in Latin America — financials, ownership and structure for 1,450+ companies across 26 exchanges, in one place.
Browse the directory →
RT
Ask Rio Times
Latin American markets, currencies and companies.
Open the full Ask Rio Times →

Restrictions on agricultural credit combined with fluctuating prices for fertilizers and pesticides further squeezed margins and impacted liquidity for both producers and distributors.

Boa Safra Eyes Strong Recovery and Expansion

Boa Safra maintains an asset-light business model through partnerships with over 160 integrated producers. The company sells primarily through resellers, which represent about 90% of revenue, expanding its commercial reach without significantly increasing credit risk.

Looking ahead, Boa Safra remains committed to growth despite recent headwinds. For 2025, the company aims to increase production capacity to 280,000 big bags, representing a 17% jump from 2024.

This expansion includes increasing contracted farming area to 274,000 hectares, a 20% year-over-year increase. The company recently announced construction of a new Distribution Center in Campo Novo do Parecis, Mato Grosso.

This facility, expected to open August 31, 2024, will serve an area exceeding 2 million hectares and forms part of the expansion plan announced during the company’s 2021 IPO.

Market analysts project significant recovery for Boa Safra in 2025. Forecasts indicate net sales will reach R$2,844 million ($498.95 million), representing 32.27% growth, while net income should recover to R$239.7 million ($42.05 million), a 49.84% increase from 2024 levels.

The current consensus among the seven analysts covering the stock remains “Buy,” with an average target price of R$17.11 per share. This suggests potential upside of over 60% from the current trading price of approximately R$10.67.

This article was produced by The Rio Times’ automated newsroom system. How we use AI · Report an error

LatAm Markets: Live Signals → — real-time movers, turnover leaders and FX across Latin America.

Read More from The Rio Times

The Rio Times · Power Map
See who really holds power in Latin America
Click to open the Power Map

Rotate for Best Experience

This report is optimized for landscape viewing. Rotate your phone for the full experience.