IBOV 186,885.49 ▲ 0.29% IPSA 10,881.28 ▼ 0.80% IPC MEX 64,214.36 ▼ 1.38% MERVAL 2,758,678 ▼ 2.15% COLCAP 2,517.56 ▼ 1.24% BVL PERÚ 59,831.84 ▼ 0.06% USD/BRL5.22▲ 0.88% USD/MXN18.28▲ 1.19% USD/CLP984.00▲ 1.18% USD/COP3,307▼ 0.79% USD/PEN3.45▲ 0.54% USD/ARS1,524▼ 0.05% USD/UYU40.29▲ 3.66% USD/PYG5,804▲ 1.99% USD/BOB11.94▲ 2.03% USD/DOP59.40▲ 3.01% USD/CRC453.80▲ 2.74% USD/GTQ7.64▲ 3.23% USD/HNL26.87▲ 3.24% USD/NIO36.62▲ 2.66% USD/VES858.02▼ 0.13% USD/PAB1.00— 0.00% USD/BZD2.00— 0.00% USD/JMD 157.28 — 0.00% USD/TTD6.69▲ 1.81% EUR/BRL5.87▼ 0.48% BRENT 88.88 ▼ 0.03% WTI 83.11 ▼ 0.11% IRON ORE 161.91 — — COPPER 6.61 ▲ 0.03% GOLD 4,461 ▲ 1.78% SILVER 65.59 ▲ 1.26% SOY 1,184 ▲ 3.20% CORN 480.50 ▲ 10.02% WHEAT 655.00 ▲ 3.93% COFFEE 317.25 ▼ 5.51% SUGAR 16.43 ▼ 1.79% ORANGE JUICE 138.55 ▼ 0.47% COTTON 85.03 ▲ 2.33% COCOA 5,719 ▲ 3.18% BEEF 223.60 ▼ 3.93% CATTLE 339.10 ▼ 3.16% LITHIUM 75.20 ▲ 1.47% PETR4 41.64 ▼ 0.05% VALE3 72.97 ▲ 0.83% ITUB4 38.60 ▼ 1.03% BBDC4 16.85 ▲ 0.36% ABEV3 14.89 ▼ 0.80% BBAS3 19.37 ▲ 0.47% B3SA3 14.26 ▼ 0.21% WEGE3 47.59 ▲ 0.49% PRIO3 59.14 ▼ 0.19% SUZB3 41.33 ▲ 2.35% RENT3 34.68 ▼ 0.09% AZZA3 15.89 ▼ 2.63% CSAN3 3.22 ▼ 1.83% RAIZ4 0.25 — 0.00% PCAR3 2.75 ▼ 0.36% GMAT3 3.65 ▼ 1.08% PSSA3 48.13 ▼ 0.54% CVCB3 1.33 ▼ 2.92% POSI3 3.36 ▲ 2.44% SLCE3 13.34 ▲ 0.30% NATU3 8.14 ▼ 0.73% IBOV 186,885.49 ▲ 0.29% IPSA 10,881.28 ▼ 0.80% IPC MEX 64,214.36 ▼ 1.38% MERVAL 2,758,678 ▼ 2.15% COLCAP 2,517.56 ▼ 1.24% BVL PERÚ 59,831.84 ▼ 0.06% USD/BRL 5.16 ▲ 0.01% USD/MXN 17.06 ▼ 0.24% USD/CLP 913.98 ▲ 0.04% USD/COP 3,140 ▲ 0.03% USD/PEN 3.36 ▼ 0.66% USD/ARS 1,493 ▲ 0.10% USD/UYU 40.27 ▲ 1.24% USD/PYG 5,939 ▲ 1.68% USD/BOB 11.64 ▼ 0.76% USD/DOP 58.34 ▲ 1.25% USD/CRC 445.92 ▲ 0.89% USD/GTQ 7.62 ▲ 2.21% USD/HNL 26.79 ▲ 1.57% USD/NIO 36.62 ▲ 0.69% USD/VES 762.44 ▼ 0.13% USD/PAB 1.00 — 0.00% USD/BZD 2.00 — 0.00% USD/JMD 157.28 — 0.00% USD/TTD 6.70 ▲ 0.61% EUR/BRL 5.95 ▲ 1.01% BRENT 88.88 ▼ 0.03% WTI 83.11 ▼ 0.11% IRON ORE 161.91 — — COPPER 6.61 ▲ 0.03% GOLD 4,461 ▲ 1.78% SILVER 65.59 ▲ 1.26% SOY 1,184 ▲ 3.20% CORN 480.50 ▲ 10.02% WHEAT 655.00 ▲ 3.93% COFFEE 317.25 ▼ 5.51% SUGAR 16.43 ▼ 1.79% ORANGE JUICE 138.55 ▼ 0.47% COTTON 85.03 ▲ 2.33% COCOA 5,719 ▲ 3.18% BEEF 223.60 ▼ 3.93% CATTLE 339.10 ▼ 3.16% LITHIUM 75.20 ▲ 1.47% PETR4 41.64 ▼ 0.05% VALE3 72.97 ▲ 0.83% ITUB4 38.60 ▼ 1.03% BBDC4 16.85 ▲ 0.36% ABEV3 14.89 ▼ 0.80% BBAS3 19.37 ▲ 0.47% B3SA3 14.26 ▼ 0.21% WEGE3 47.59 ▲ 0.49% PRIO3 59.14 ▼ 0.19% SUZB3 41.33 ▲ 2.35% RENT3 34.68 ▼ 0.09% AZZA3 15.89 ▼ 2.63% CSAN3 3.22 ▼ 1.83% RAIZ4 0.25 — 0.00% PCAR3 2.75 ▼ 0.36% GMAT3 3.65 ▼ 1.08% PSSA3 48.13 ▼ 0.54% CVCB3 1.33 ▼ 2.92% POSI3 3.36 ▲ 2.44% SLCE3 13.34 ▲ 0.30% NATU3 8.14 ▼ 0.73%
since 2009
Thursday, October 1, 2026

Brazil Life & Society

Concrete Jungles: Brazil’s Megacities Among World’s Most Dysfunctional

By · May 22, 2025 · 2 min read

The LatAm Brief

One email, every weekday morning. What moved in Latin American markets, politics and expat life.

Yesterday’s subject line: “Banxico has missed its target for 75 months in a row”

Free. We send a confirmation link first — nothing arrives until you click it. Unsubscribe with one click in any edition. If you stop opening us for 30 days we stop sending by ourselves, as we assume the interest is no longer there. See our privacy policy. We never share your email.

The latest Oxford Economics Global Cities Index 2025 reveals the stark reality of Brazilian urban centers. São Paulo, Brazil’s economic powerhouse, ranks only 303rd among the world’s 1,000 most populous cities.

This dismal showing highlights the significant challenges facing Brazilian metropolises despite their massive size and regional importance. Brazilian cities consistently underperform in global rankings across multiple dimensions.

Rio de Janeiro has experienced a particularly troubling decline, falling to position 100 in the Resonance World’s Best Cities 2025 ranking, dropping 37 places from the previous year to the bottom of the list.

Free daily brief — no card needed
Get every Brazil story in one morning email
We build you a personalized brief around the topics you follow — free for 7 days. Love it? Your first month after that is US$1.

The city continues to struggle with high violence rates, poor education, and inadequate infrastructure. The infrastructure deficiencies in Brazilian urban areas are staggering.

According to the World Economic Forum, Brazil ranks 108th among 137 economies in terms of general infrastructure quality. These shortcomings result in high logistics costs, estimated at approximately 15% of GDP compared to 8-10% in developed countries.
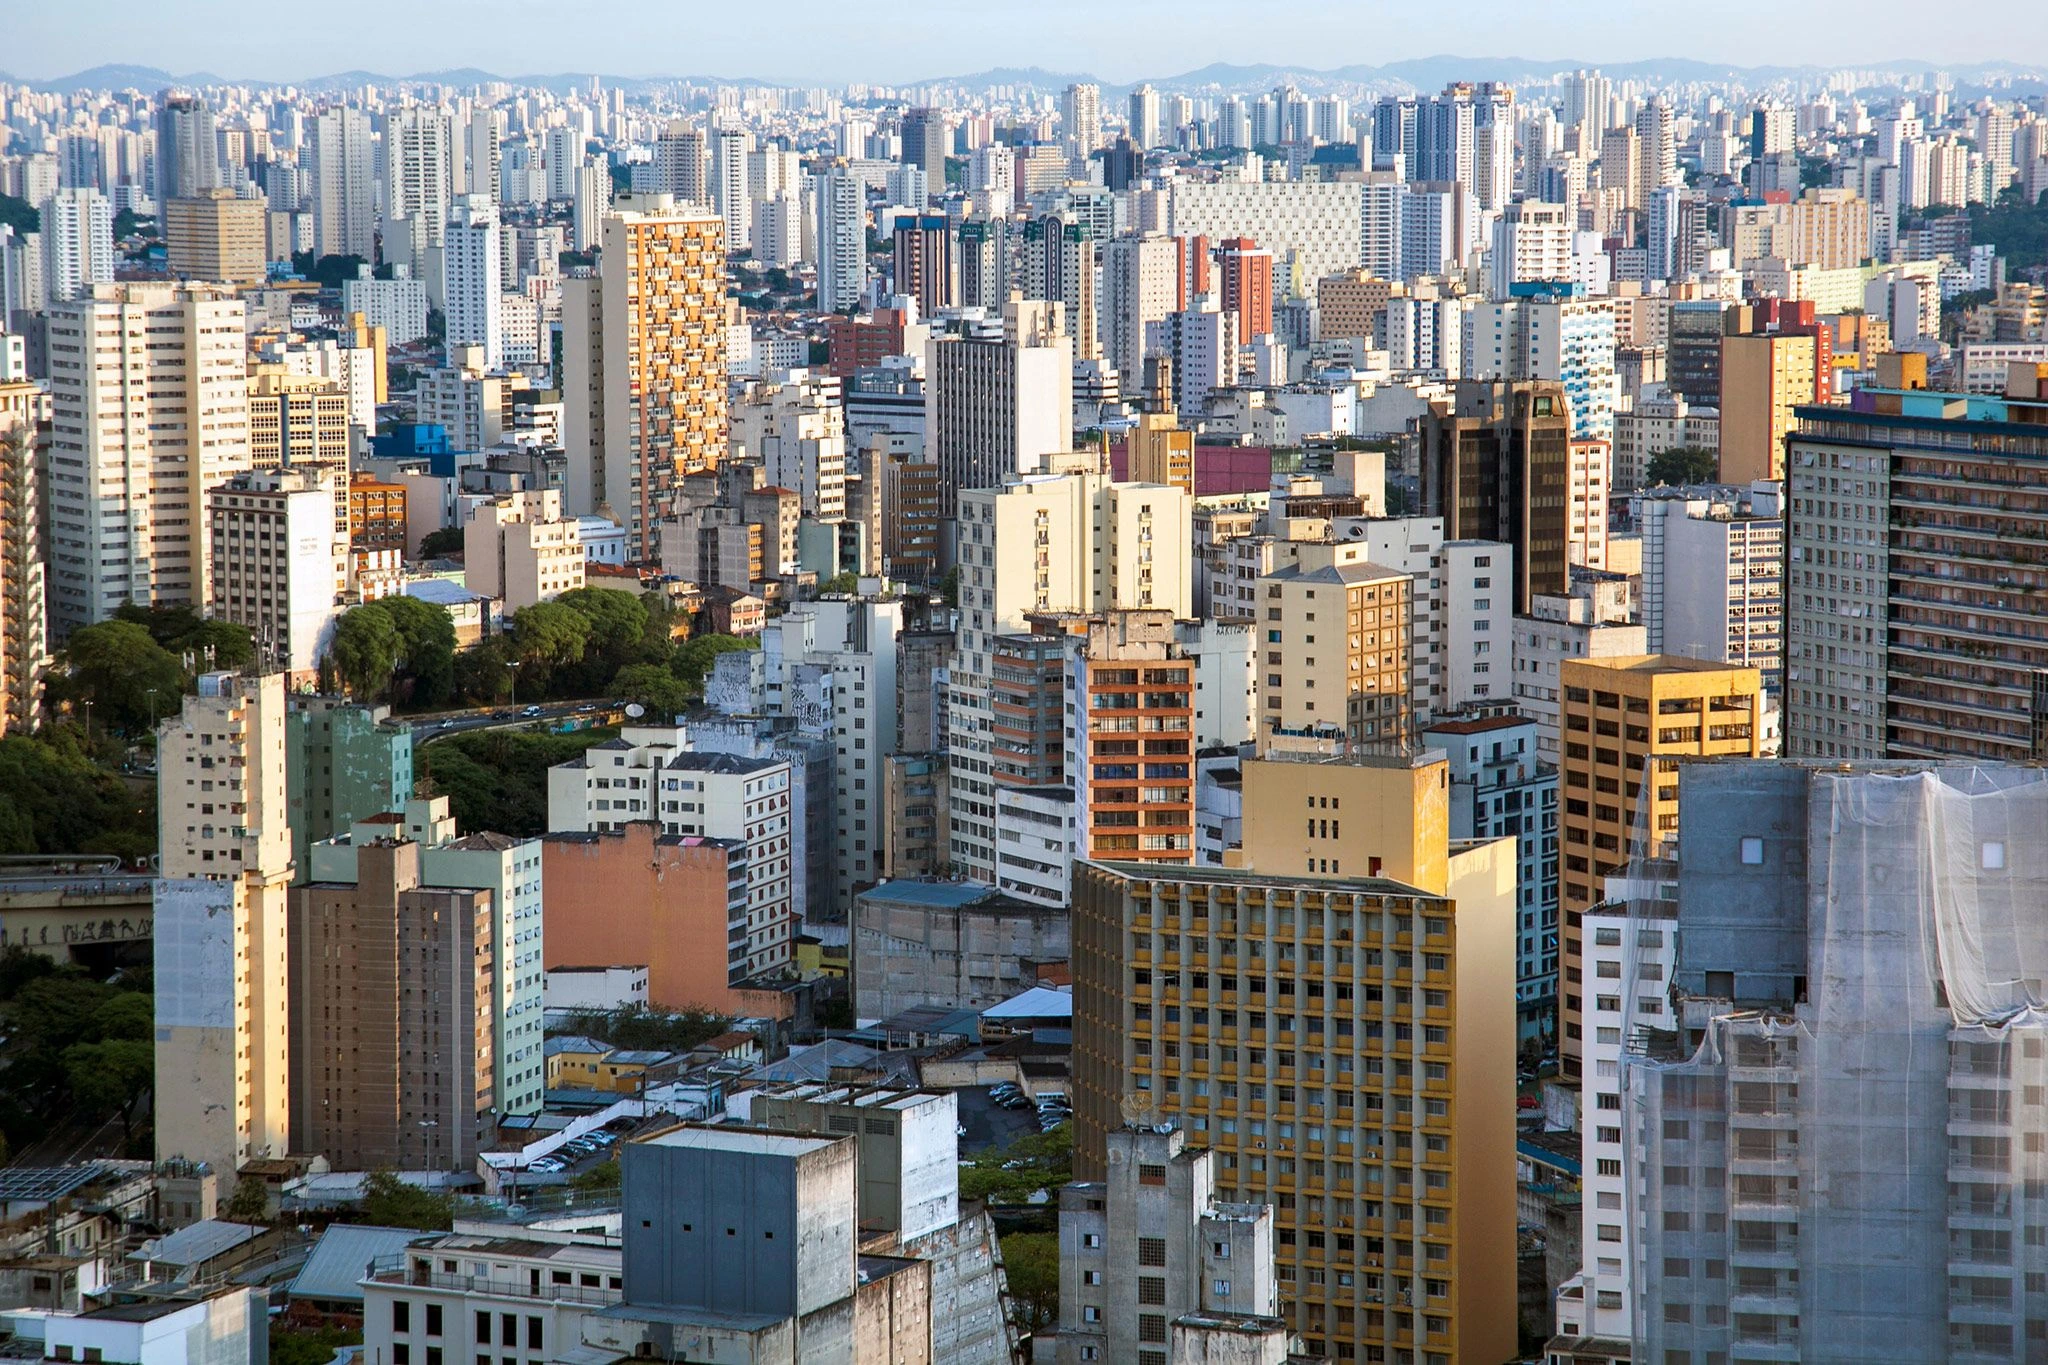
Concrete Jungles: Brazil's Megacities Among World's Most Dysfunctional
Concrete Jungles: Brazil’s Megacities Among World’s Most Dysfunctional.
One-stop reference
Company Intelligence
Every listed company in Latin America — financials, ownership and structure for 1,450+ companies across 26 exchanges, in one place.
Browse the directory →
RT
Ask Rio Times
17 years of Latin America reporting, on demand.
Open the full Ask Rio Times →

Unplanned urbanization has created massive problems. With 87% of its population living in urban areas concentrated in just 0.31% of the national territory, Brazilian cities face severe housing shortages.

The country has a housing deficit of approximately 6.5 million houses, despite having around 8 million empty homes. Basic services remain inaccessible to many urban dwellers.

Nearly 42% of urban residents lack proper sanitation and sewage facilities. In Belém, 54.47% of the urban population lives in informal settlements. When considering inadequate housing overall, this figure reaches 41.4% nationwide.

Public safety remains a critical concern. Brazil records 153 violent deaths daily, with violent deaths accounting for more than 50% of fatalities among 15-19 year-olds. This grim statistic makes Brazilian cities among the most dangerous in the world.

Transportation infrastructure is equally problematic. Brazilian cities rank among the 100 most congested globally. Nearly half of all municipalities lack any public bus service, and close to 80% of the bus fleet fails to accommodate people with disabilities or reduced mobility.

The income disparity within Brazilian cities is shocking. In São Paulo, the income differential between central and peripheral areas reaches 65.4%, with a 56.1% average across major metropolises. Population growth occurs primarily in these significantly poorer areas while gentrified areas remain stagnant.

While cities like New York, London, and Paris continue to dominate global urban rankings through strong economic performance, quality infrastructure, and effective governance, Brazilian cities remain trapped in a cycle of inequality.

They also struggle with violence and inadequate public services. Without addressing these fundamental issues, Brazilian urban centers will continue to lag far behind their global counterparts.

This article was drafted with automated assistance and reviewed before publication. How we use AI · Report an error

Read More from The Rio Times

The Rio Times · Power Map
See who really holds power in Latin America
Click to open the Power Map →

Rotate for Best Experience

This report is optimized for landscape viewing. Rotate your phone for the full experience.