IBOV 185,147.15 ▼ 0.02% IPSA 11,315.26 ▼ 1.14% IPC MEX 64,866.61 ▼ 0.87% MERVAL 3,049,121 ▼ 0.29% COLCAP 2,544.56 ▲ 0.40% BVL PERÚ 59,978.22 ▼ 0.31% USD/BRL5.12▼ 0.05% USD/MXN16.88▼ 0.04% USD/CLP933.68— 0.00% USD/COP3,132▲ 0.23% USD/PEN3.35▼ 0.02% USD/ARS1,509▼ 0.02% USD/UYU40.24— 0.00% USD/PYG5,947— 0.00% USD/BOB12.40— 0.00% USD/DOP59.00— 0.00% USD/CRC448.67— 0.00% USD/GTQ7.63— 0.00% USD/HNL26.84— 0.00% USD/NIO36.62— 0.00% USD/VES805.37▼ 0.90% USD/PAB1.00— 0.00% USD/BZD2.00— 0.00% USD/JMD 157.28 — 0.00% USD/TTD6.71— 0.00% EUR/BRL5.96▲ 0.48% BRENT 88.88 ▼ 0.03% WTI 83.11 ▼ 0.11% IRON ORE 161.91 — — COPPER 6.61 ▲ 0.03% GOLD 4,461 ▲ 1.78% SILVER 65.59 ▲ 1.26% SOY 1,184 ▲ 3.20% CORN 480.50 ▲ 10.02% WHEAT 655.00 ▲ 3.93% COFFEE 317.25 ▼ 5.51% SUGAR 16.43 ▼ 1.79% ORANGE JUICE 138.55 ▼ 0.47% COTTON 85.03 ▲ 2.33% COCOA 5,719 ▲ 3.18% BEEF 223.60 ▼ 3.93% CATTLE 339.10 ▼ 3.16% LITHIUM 75.20 ▲ 1.47% PETR4 41.64 ▼ 0.05% VALE3 72.97 ▲ 0.83% ITUB4 38.60 ▼ 1.03% BBDC4 16.85 ▲ 0.36% ABEV3 14.89 ▼ 0.80% BBAS3 19.37 ▲ 0.47% B3SA3 14.26 ▼ 0.21% WEGE3 47.59 ▲ 0.49% PRIO3 59.14 ▼ 0.19% SUZB3 41.33 ▲ 2.35% RENT3 34.68 ▼ 0.09% AZZA3 15.89 ▼ 2.63% CSAN3 3.22 ▼ 1.83% RAIZ4 0.25 — 0.00% PCAR3 2.75 ▼ 0.36% GMAT3 3.65 ▼ 1.08% PSSA3 48.13 ▼ 0.54% CVCB3 1.33 ▼ 2.92% POSI3 3.36 ▲ 2.44% SLCE3 13.34 ▲ 0.30% NATU3 8.14 ▼ 0.73% IBOV 185,147.15 ▼ 0.02% IPSA 11,315.26 ▼ 1.14% IPC MEX 64,866.61 ▼ 0.87% MERVAL 3,049,121 ▼ 0.29% COLCAP 2,544.56 ▲ 0.40% BVL PERÚ 59,978.22 ▼ 0.31% USD/BRL 5.16 ▲ 0.01% USD/MXN 17.06 ▼ 0.24% USD/CLP 913.98 ▲ 0.04% USD/COP 3,140 ▲ 0.03% USD/PEN 3.36 ▼ 0.66% USD/ARS 1,493 ▲ 0.10% USD/UYU 40.27 ▲ 1.24% USD/PYG 5,939 ▲ 1.68% USD/BOB 11.64 ▼ 0.76% USD/DOP 58.34 ▲ 1.25% USD/CRC 445.92 ▲ 0.89% USD/GTQ 7.62 ▲ 2.21% USD/HNL 26.79 ▲ 1.57% USD/NIO 36.62 ▲ 0.69% USD/VES 762.44 ▼ 0.13% USD/PAB 1.00 — 0.00% USD/BZD 2.00 — 0.00% USD/JMD 157.28 — 0.00% USD/TTD 6.70 ▲ 0.61% EUR/BRL 5.95 ▲ 1.01% BRENT 88.88 ▼ 0.03% WTI 83.11 ▼ 0.11% IRON ORE 161.91 — — COPPER 6.61 ▲ 0.03% GOLD 4,461 ▲ 1.78% SILVER 65.59 ▲ 1.26% SOY 1,184 ▲ 3.20% CORN 480.50 ▲ 10.02% WHEAT 655.00 ▲ 3.93% COFFEE 317.25 ▼ 5.51% SUGAR 16.43 ▼ 1.79% ORANGE JUICE 138.55 ▼ 0.47% COTTON 85.03 ▲ 2.33% COCOA 5,719 ▲ 3.18% BEEF 223.60 ▼ 3.93% CATTLE 339.10 ▼ 3.16% LITHIUM 75.20 ▲ 1.47% PETR4 41.64 ▼ 0.05% VALE3 72.97 ▲ 0.83% ITUB4 38.60 ▼ 1.03% BBDC4 16.85 ▲ 0.36% ABEV3 14.89 ▼ 0.80% BBAS3 19.37 ▲ 0.47% B3SA3 14.26 ▼ 0.21% WEGE3 47.59 ▲ 0.49% PRIO3 59.14 ▼ 0.19% SUZB3 41.33 ▲ 2.35% RENT3 34.68 ▼ 0.09% AZZA3 15.89 ▼ 2.63% CSAN3 3.22 ▼ 1.83% RAIZ4 0.25 — 0.00% PCAR3 2.75 ▼ 0.36% GMAT3 3.65 ▼ 1.08% PSSA3 48.13 ▼ 0.54% CVCB3 1.33 ▼ 2.92% POSI3 3.36 ▲ 2.44% SLCE3 13.34 ▲ 0.30% NATU3 8.14 ▼ 0.73%
since 2009
Sunday, September 6, 2026

Brazil Business - Brazil

BRF Shares Drop Amid Mixed 4Q24 Results and Rising Costs

By · February 27, 2025 · 2 min read

Daily Brief

The morning intel from across Latin America. Free.

By subscribing you agree to our privacy policy. We never share your email.

BRF (BRFS3), one of Brazil’s largest food companies, saw its shares fall over 5% on February 27, 2025, after releasing its fourth-quarter 2024 (4Q24) results.

The decline reflects investor concerns over rising production costs and shrinking margins, despite strong revenue growth and improved operational performance. Analysts offered mixed views on the company’s outlook, highlighting both opportunities and risks.

BRF reported net revenue of R$17.5 billion ($2.92 billion) in 4Q24, a 21.6% increase year-over-year (YoY). Adjusted EBITDA reached R$2.8 billion ($467 million), up 47.2% YoY but 6% lower than the previous quarter.

The EBITDA margin stood at 16%, an improvement from 13.2% in 4Q23 but below market expectations due to higher input costs. Corn prices rose by 11% quarter-over-quarter, while soybean oil costs increased by 15.6%. Labor expenses also contributed to cost pressures.

Despite these challenges, BRF achieved a record-breaking year in 2024, with annual revenue of R$61.4 billion ($10.23 billion), up 14% from 2023. Net income for the year reached R$3.7 billion ($617 million), marking the highest profit in the company’s history.
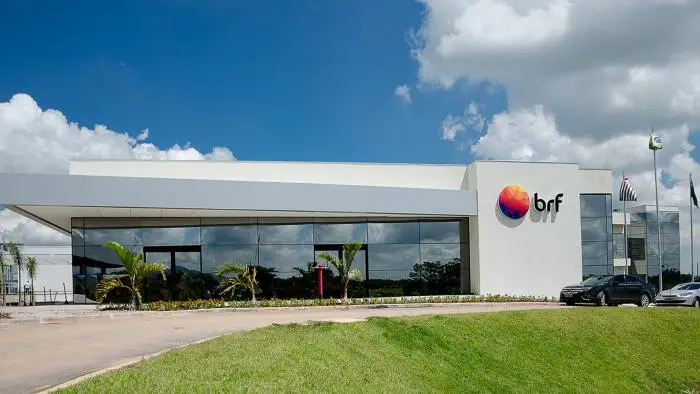
BRF Shares Drop Amid Mixed 4Q24 Results and Rising Costs
BRF Shares Drop Amid Mixed 4Q24 Results and Rising Costs.
RT
Ask Rio Times
Latin American markets, currencies and companies.
Open the full Ask Rio Times →

The leverage ratio improved significantly, with net debt-to-EBITDA dropping to 0.79x from 2.01x in the prior year. Analysts remain divided on BRF’s future prospects. Citi maintained a “buy” rating with a target price of R$32 ($5.33), citing strong sales growth (+16% YoY) and potential relief from falling soybean prices.

BRF Stock Outlook

XP Investimentos also recommended buying, setting a target price of R$30.10 ($5.02), supported by improving international markets and reduced U.S. competition in poultry exports.

However, caution persists among some analysts. BTG Pactual issued a neutral rating with a target price of R$25, warning that elevated market expectations may not align with the company’s current margin cycle.

Goldman Sachs adopted a neutral stance with a target price of R$27.20. The firm noted that adjusted EBITDA fell short of consensus estimates by 11%.

BRF’s management remains optimistic about future growth, emphasizing plans to expand its processed foods segment and leverage Brazil’s upcoming corn harvest (“safrinha”).

CEO Miguel Gularte highlighted stronger-than-expected sales in early 2025 and opportunities in international markets like Japan and the Middle East.

While BRF’s fundamentals remain solid, rising costs and shifting market dynamics pose challenges for sustained profitability. Investors must weigh its long-term potential against near-term risks.

Live Company IntelligenceMarfrig Global Foods SA — the full investor dossierInside: live share price, market cap, three-year financials, valuation, ESG and peer benchmarks — plus the latest Rio Times coverage.
M
◆ Live Company Intelligence
Marfrig Global Foods
SA: MBRF3MBRF3Consumer DefensivePackaged Foods130,000 employees
R$24.65B
Market cap

Valuation & profitability

Market capR$24.65B
Revenue (TTM)R$165.85B
P / E ratio63.2
Profit margin0.2%
Return on equity0.9%

Price & risk

52-wk low
$14.49
52-wk high
$26.83
Beta (volatility)0.02
200-day average$18.08

Revenue trend · 6y

20202025
Latest R$163.96B

Ownership

Institutions34.5%
Shares outstanding1.39B

Dividend

No regular dividend — earnings reinvested for growth.
What Marfrig Global Foods does. MBRF Global Foods Company S.A., through its subsidiaries, operates in the food industry in Brazil and internationally. It operates through Beef North America, Beef South America, and BRF segments. The company produces, processes, distributes, and sells animal-based proteins, such as beef, pork, lamb, fish, and poultry; pasta, margarine, vegetable, pet food, and…
Data: RT fundamentals (MBRF3.SA) · figures in BRL · as of 6 Sep 2026More company intelligence →

This article was produced by The Rio Times’ automated newsroom system. How we use AI · Report an error

LatAm Markets: Live Signals → — real-time movers, turnover leaders and FX across Latin America.

Read More from The Rio Times

The Rio Times · Power Map
See who really holds power in Latin America
Click to open the Power Map

Rotate for Best Experience

This report is optimized for landscape viewing. Rotate your phone for the full experience.