IBOV 171,977.92 ▲ 2.41% IPSA 11,345.41 ▲ 0.96% IPC MEX 65,223.89 ▲ 1.36% MERVAL 2,931,172 ▲ 1.92% COLCAP 2,454.74 ▲ 0.43% BVL PERÚ 58,698.13 ▲ 1.62% USD/BRL5.15▼ 0.98% USD/MXN16.90▼ 0.30% USD/CLP915.06▼ 0.76% USD/COP3,041▼ 0.34% USD/PEN3.34▼ 0.28% USD/ARS1,498▲ 0.05% USD/UYU40.20▲ 1.58% USD/PYG5,996▲ 1.55% USD/BOB11.43▲ 0.41% USD/DOP58.74▲ 0.07% USD/CRC450.05▲ 3.34% USD/GTQ7.62▲ 2.21% USD/HNL26.81▲ 0.31% USD/NIO36.62▲ 0.29% USD/VES778.00▼ 0.13% USD/PAB1.00— 0.00% USD/BZD2.00— 0.00% USD/JMD 157.28 — 0.00% USD/TTD6.71▲ 0.79% EUR/BRL6.01▼ 0.49% BRENT 88.88 ▼ 0.03% WTI 83.11 ▼ 0.11% IRON ORE 161.91 — — COPPER 6.61 ▲ 0.03% GOLD 4,461 ▲ 1.78% SILVER 65.59 ▲ 1.26% SOY 1,184 ▲ 3.20% CORN 480.50 ▲ 10.02% WHEAT 655.00 ▲ 3.93% COFFEE 317.25 ▼ 5.51% SUGAR 16.43 ▼ 1.79% ORANGE JUICE 138.55 ▼ 0.47% COTTON 85.03 ▲ 2.33% COCOA 5,719 ▲ 3.18% BEEF 223.60 ▼ 3.93% CATTLE 339.10 ▼ 3.16% LITHIUM 75.20 ▲ 1.47% PETR4 41.64 ▼ 0.05% VALE3 72.97 ▲ 0.83% ITUB4 38.60 ▼ 1.03% BBDC4 16.85 ▲ 0.36% ABEV3 14.89 ▼ 0.80% BBAS3 19.37 ▲ 0.47% B3SA3 14.26 ▼ 0.21% WEGE3 47.59 ▲ 0.49% PRIO3 59.14 ▼ 0.19% SUZB3 41.33 ▲ 2.35% RENT3 34.68 ▼ 0.09% AZZA3 15.89 ▼ 2.63% CSAN3 3.22 ▼ 1.83% RAIZ4 0.25 — 0.00% PCAR3 2.75 ▼ 0.36% GMAT3 3.65 ▼ 1.08% PSSA3 48.13 ▼ 0.54% CVCB3 1.33 ▼ 2.92% POSI3 3.36 ▲ 2.44% SLCE3 13.34 ▲ 0.30% NATU3 8.14 ▼ 0.73% IBOV 171,977.92 ▲ 2.41% IPSA 11,345.41 ▲ 0.96% IPC MEX 65,223.89 ▲ 1.36% MERVAL 2,931,172 ▲ 1.92% COLCAP 2,454.74 ▲ 0.43% BVL PERÚ 58,698.13 ▲ 1.62% USD/BRL 5.16 ▲ 0.01% USD/MXN 17.06 ▼ 0.24% USD/CLP 913.98 ▲ 0.04% USD/COP 3,140 ▲ 0.03% USD/PEN 3.36 ▼ 0.66% USD/ARS 1,493 ▲ 0.10% USD/UYU 40.27 ▲ 1.24% USD/PYG 5,939 ▲ 1.68% USD/BOB 11.64 ▼ 0.76% USD/DOP 58.34 ▲ 1.25% USD/CRC 445.92 ▲ 0.89% USD/GTQ 7.62 ▲ 2.21% USD/HNL 26.79 ▲ 1.57% USD/NIO 36.62 ▲ 0.69% USD/VES 762.44 ▼ 0.13% USD/PAB 1.00 — 0.00% USD/BZD 2.00 — 0.00% USD/JMD 157.28 — 0.00% USD/TTD 6.70 ▲ 0.61% EUR/BRL 5.95 ▲ 1.01% BRENT 88.88 ▼ 0.03% WTI 83.11 ▼ 0.11% IRON ORE 161.91 — — COPPER 6.61 ▲ 0.03% GOLD 4,461 ▲ 1.78% SILVER 65.59 ▲ 1.26% SOY 1,184 ▲ 3.20% CORN 480.50 ▲ 10.02% WHEAT 655.00 ▲ 3.93% COFFEE 317.25 ▼ 5.51% SUGAR 16.43 ▼ 1.79% ORANGE JUICE 138.55 ▼ 0.47% COTTON 85.03 ▲ 2.33% COCOA 5,719 ▲ 3.18% BEEF 223.60 ▼ 3.93% CATTLE 339.10 ▼ 3.16% LITHIUM 75.20 ▲ 1.47% PETR4 41.64 ▼ 0.05% VALE3 72.97 ▲ 0.83% ITUB4 38.60 ▼ 1.03% BBDC4 16.85 ▲ 0.36% ABEV3 14.89 ▼ 0.80% BBAS3 19.37 ▲ 0.47% B3SA3 14.26 ▼ 0.21% WEGE3 47.59 ▲ 0.49% PRIO3 59.14 ▼ 0.19% SUZB3 41.33 ▲ 2.35% RENT3 34.68 ▼ 0.09% AZZA3 15.89 ▼ 2.63% CSAN3 3.22 ▼ 1.83% RAIZ4 0.25 — 0.00% PCAR3 2.75 ▼ 0.36% GMAT3 3.65 ▼ 1.08% PSSA3 48.13 ▼ 0.54% CVCB3 1.33 ▼ 2.92% POSI3 3.36 ▲ 2.44% SLCE3 13.34 ▲ 0.30% NATU3 8.14 ▼ 0.73%
since 2009
Friday, August 21, 2026

Brazil Business - Brazil

Brazil’s Iron Ore Exports Rebound to Pre-Brumadinho Levels, Signaling Industry Recovery

By · January 15, 2025 · 2 min read

Daily Brief

The morning intel from across Latin America. Free.

By subscribing you agree to our privacy policy. We never share your email.

Brazil’s iron ore exports have surged to levels not seen since before the 2019 Brumadinho dam disaster. The country shipped 389.1 million tonnes of iron ore in 2024, nearly matching the 389.8 million tonnes exported in 2018.

This data comes from Brazil’s Ministry of Development, Industry, and Foreign Trade. The export recovery marks a significant milestone for Brazil’s mining sector.

Shipments had plummeted 10% in 2019 following the tragic dam collapse at Vale’s Córrego do Feijão mine. The disaster killed 270 people and devastated the local environment.

Vale, Brazil’s largest iron ore producer, led the export rebound. The company accounted for about 70% of total iron ore shipments in 2024. Other factors driving the recovery included new market entrants and expanded operations by established firms.

China remained the top buyer of Brazilian iron ore, receiving 67% of exports. Malaysia ranked second with a 5.4% share. Within Brazil, the states of Pará and Minas Gerais dominated production.
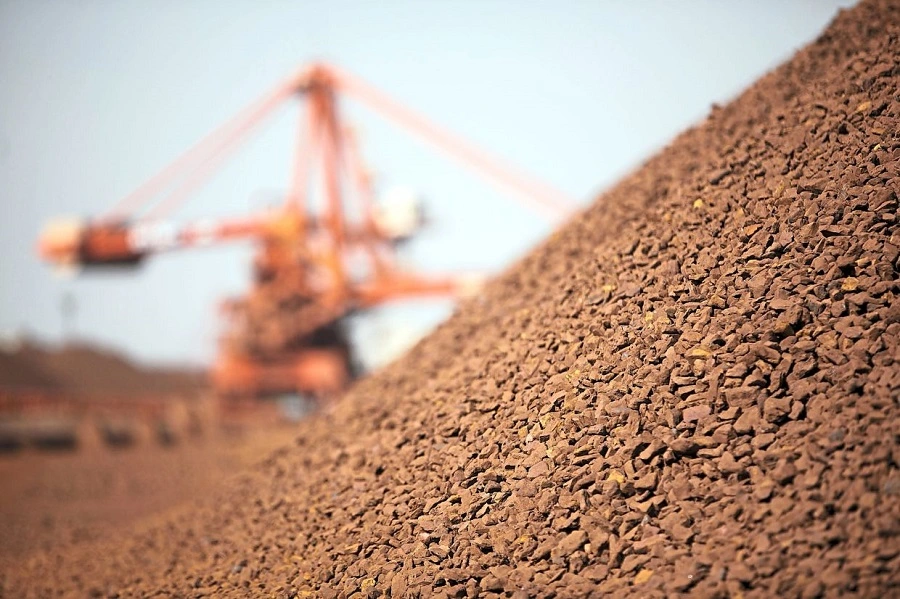
Brazil's Iron Ore Exports Rebound to Pre-Brumadinho Levels, Signaling Industry Recovery
Brazil’s Iron Ore Exports Rebound to Pre-Brumadinho Levels, Signaling Industry Recovery. (Photo Internet reproduction)
One-stop reference
Company Intelligence
Every listed company in Latin America — financials, ownership and structure for 1,450+ companies across 26 exchanges, in one place.
Browse the directory →

Brazil’s Iron Ore Exports

They accounted for 43.2% and 42.4% of exports respectively. Despite higher export volumes, revenues declined slightly in 2024. Brazil earned $29.8 billion from iron ore exports, down 2.4% from 2023.

This drop reflected lower global iron ore prices, which fluctuated between $90 and $145 per tonne. Industry experts expect Brazilian iron ore exports to remain strong in 2025.

Vale aims to produce 325-335 million tonnes, up from 328 million in 2024. CSN Mineração targets 42-43.5 million tonnes, similar to its 2024 output. However, challenges loom on the horizon.

Analysts predict that reduced steel demand in China could limit import growth. Additionally, new iron ore projects in Africa may increase global supply later this decade. The export rebound demonstrates the resilience of Brazil’s mining sector.

It also highlights the ongoing importance of iron ore to the country’s economy. As the industry moves forward, balancing growth with safety and environmental concerns remains crucial.

Live Market IntelligenceBrazil — Live Market BoardInside: market breadth, the sector heatmap, currencies & rates, the Latin America scoreboard and the full instrument board.

Rio Times · Live Market Intelligence

Brazil — Live Market Board

B3 · São Paulo
Aug 21, 2026 · 14:52

Ibovespa · benchmark
171,977.92
+2.41%
L 167,142day rangeH 168,310

+21.85% over 12 months

Market breadth · 15 names
47% advancing

7 ▲ advancing8 declining ▼

Currencies, rates & key inputs
USD / BRL
5.16
+0.01%

EUR / BRL
5.95
+1.01%

Selic rate
14.00%
·

Brent crude
88.88
-0.03%

Iron ore
161.91
·

Sector heatmap · average move today
Materials
+2.35%
SUZB3

Mining
+1.16%
VALE3, CSNA3, GGBR4

Industrials
+0.20%
WEGE3, RENT3

Financials
-0.10%
ITUB4, BBDC4, BBAS3, B3SA3

Energy
-0.12%
PETR4, PRIO3

Consumer Staples
-0.80%
ABEV3

Utilities
-1.38%
ENEV3

Consumer Disc.
-2.63%
AZZA3

Latin America scoreboard
IndexLastTodayStrength
IbovespaBrazil
171,977.92
+2.41%

S&P/BMV IPCMexico
65,223.89
+1.36%

S&P IPSAChile
11,345.41
+0.96%

S&P MERVALArgentina
2,931,172
+1.92%

MSCI COLCAPColombia
2,454.74
+0.43%

BVL S&P PerúPeru
58,698.13
+1.62%

Full instrument board
Instrument Last Change YoY Prev. High Low Volume
IBOV 171,977.92 +2.41% +21.85% 167,927.15 168,310 167,142
USD/BRL 5.16 +0.01% -5.13% 5.16 5.18 5.14
SELIC 14.00%
PETR4 41.64 -0.05% +35.19% 41.66 41.97 41.15 41,499,400
VALE3 72.97 +0.83% +30.75% 72.37 73.54 72.66 17,658,000
ITUB4 38.60 -1.03% +4.57% 39.00 39.34 38.39 29,487,800
BBDC4 16.85 +0.36% +3.50% 16.79 16.90 16.67 19,416,900
BBAS3 19.37 +0.47% +0.73% 19.28 19.44 19.16 11,069,200
B3SA3 14.26 -0.21% +12.73% 14.29 14.47 14.11 33,037,800
ABEV3 14.89 -0.80% +21.91% 15.01 15.07 14.81 16,453,100
WEGE3 47.59 +0.49% +29.99% 47.36 48.08 47.36 3,364,600
PRIO3 59.14 -0.19% +50.67% 59.25 59.81 58.74 3,325,600
SUZB3 41.33 +2.35% -23.55% 40.38 41.48 40.35 3,914,900
RENT3 34.68 -0.09% +0.84% 34.71 34.96 34.35 7,979,100
AZZA3 15.89 -2.63% -53.76% 16.32 16.42 15.82 1,330,300
CSNA3 4.30 +0.47% -42.65% 4.28 4.41 4.26 10,076,100
GGBR4 24.69 +2.19% +51.38% 24.16 24.85 24.18 7,047,600
ENEV3 24.21 -1.38% +70.49% 24.55 24.64 23.99 9,297,000

Largest moves today
AZZA3
15.89
-2.63%
IBOV
171,977.92
+2.41%
SUZB3
41.33
+2.35%
GGBR4
24.69
+2.19%
ENEV3
24.21
-1.38%
ITUB4
38.60
-1.03%
VALE3
72.97
+0.83%
ABEV3
14.89
-0.80%

The session read
The Ibovespa rose 2.41%, with breadth negative — 7 of 15 names higher. Materials led, while Consumer Disc. lagged.

This article was produced by The Rio Times’ automated newsroom system. How we use AI · Report an error

LatAm Markets: Live Signals → — real-time movers, turnover leaders and FX across Latin America.

Read More from The Rio Times

The Rio Times · Power Map
See who really holds power in Latin America
Click to open the Power Map

Rotate for Best Experience

This report is optimized for landscape viewing. Rotate your phone for the full experience.