Gold Retreats to $5,097 as Oil Shock Triggers Profit-Taking
March 9, 2026 · Rio Times Online · Precious Metals
This is part of The Rio Times’ daily coverage of precious metals markets and Latin American financial markets.
\n
\n
02Market Commentary
\n
Gold closed the week at $5,097 — its worst weekly performance in months — as a paradoxical dynamic played out: the very war that should be driving safe-haven buying into gold is simultaneously destroying the metal’s rate-cut tailwind. Brent crude’s 28% weekly surge to $92.69, now past $110 on Monday, feeds directly into inflation expectations, and the market has quickly repriced — Fed Fund Futures now assign just 4.4% probability to a March cut, with the next move pushed to July at best. Non-yielding gold cannot compete when real rates are rising on an oil-driven inflation shock.
\n
Friday’s NFP print of −92,000 jobs added a second dimension to the pressure. The data was recessionary — the first job losses since October 2025 — but instead of unambiguously supporting rate cuts, it merely deepened the stagflation dilemma. The Fed is now boxed: collapsing employment argues for cuts, while $110 oil argues for holding or even hiking. Gold, which thrives in either a rate-cut or a crisis environment, struggles when both forces neutralize each other.
\n
\n
\n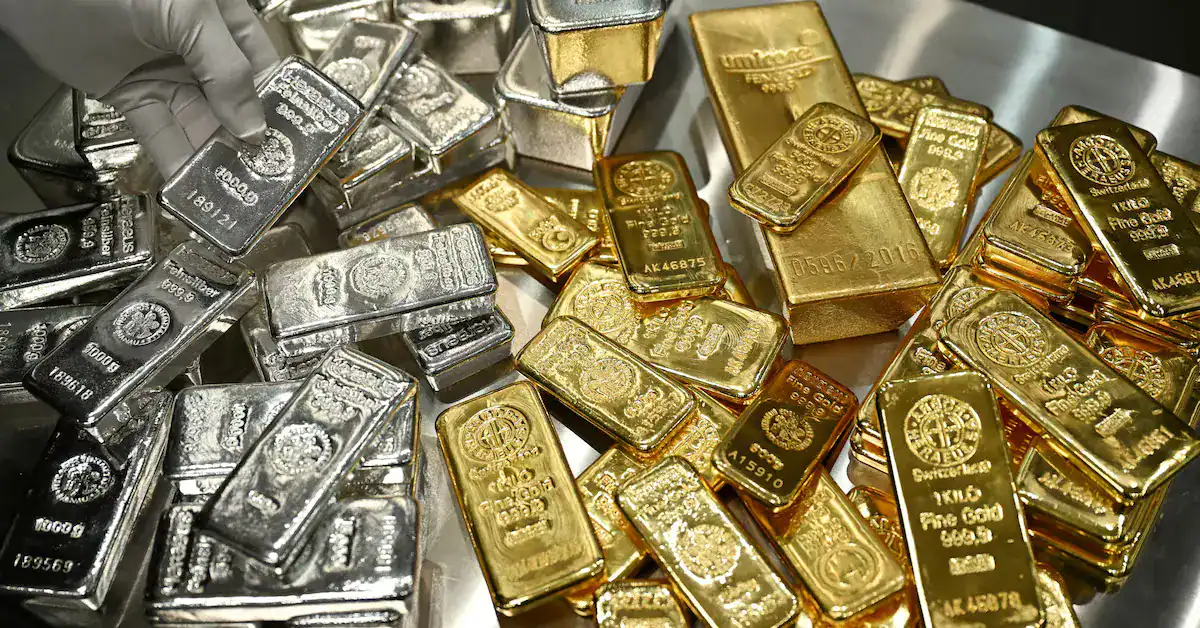
\n
Silver’s session was markedly more violent. The white metal plunged to an intraday low of $79.61 — a 6% peak-to-trough swing — before recovering to close at $83.19. This amplified volatility is classic silver: it carries gold’s safe-haven premium but layers on industrial demand sensitivity that makes it more exposed to recession fears. The gold/silver ratio held steady at 61.6, well below the 80+ levels that characterized previous bear markets, suggesting silver’s structural bid from solar, EV, and defense applications remains intact.
\n
Institutional flows remained constructive beneath the surface. The World Gold Council reported on March 5 that gold ETFs absorbed $5.3 billion (+26 tonnes) in February, led by North American and Asian funds. Chinese premiums held firm even as Indian retail demand paused at $5,000+ prices. The structural bid from central banks — projected at 755 tonnes for 2026 by JPMorgan — provides a floor that purely speculative selling cannot easily breach.
\n
\n
\n
\n
03Technical Analysis
\n
Gold (XAU/USD, 1D, Capital.com).
\n
The latest daily candle closed at $5,097.05 (O: $5,178.47, H: $5,200.92, L: $5,014.50), a bearish engulfing pattern that sliced through the Ichimoku cloud from above. Price now sits at the cloud base near $5,097, with the cloud top at $5,169. The 200-day SMA at $4,014 remains far below — a testament to the magnitude of this bull run — while the Bollinger bands contract around the $4,881–$5,207 range. The MACD histogram has turned negative at −18.02, with the MACD line (73.88) crossing below the signal line (91.90), confirming short-term bearish momentum. RSI reads 56.57/52.03, retreating from recent highs but still above neutral — room to fall further before oversold.
\n
\n
Silver (XAG/USD, 1D, Capital.com).
\n
Silver closed at $83.188 (O: $84.762, H: $85.015, L: $79.607), printing a wide-range bearish candle with a deep lower wick that suggests buyers stepped in near $80. Price sits just above the Ichimoku cloud ($82.95–$83.67 zone), making this a critical inflection point. The 200-day SMA at $55.28 is 34% below current levels. The MACD histogram is narrowly negative at −0.152, with signal at 0.193 and MACD line at 0.041 — momentum is weak but not yet deeply bearish. RSI at 51.09/48.66 straddles the neutral line, reflecting silver’s indecision.
\n
\n
\n
\n
Gold Support & Resistance
\n
\n
| Level | Price | Reference |
|---|---|---|
| Resistance 3 | $5,589 | All-time high (Jan 28) |
| Resistance 2 | $5,207 | Bollinger upper band |
| Resistance 1 | $5,170 | Ichimoku cloud top |
| Pivot | $5,097 | Current close / cloud base |
| Support 1 | $5,059 | Bollinger midline |
| Support 2 | $4,936 | Kijun-sen |
| Support 3 | $4,881 | Bollinger lower band |
\n
\n
Silver Support & Resistance
\n
\n
| Level | Price | Reference |
|---|---|---|
| Resistance 3 | $93.50 | Bollinger upper band |
| Resistance 2 | $87.15 | Recent swing high |
| Resistance 1 | $85.83 | Ichimoku Senkou A |
| Pivot | $83.19 | Current close |
| Support 1 | $82.95 | Ichimoku cloud base |
| Support 2 | $80.20 | Kijun-sen |
| Support 3 | $72.41 | Bollinger lower band |
\n
\n
\n
Live Market IntelligenceCommodities — Live Market Board
Rio Times · Live Market Intelligence
Commodities — Live Market Board
-0.03%
| Instrument | Last | Change | YoY | Prev. | High | Low | Volume |
|---|---|---|---|---|---|---|---|
| GOLD | 4,461 | +1.78% | +33.20% | 4,383 | 4,503 | 4,421 | 139,824 |
| SILVER | 65.59 | +1.26% | +73.05% | 64.77 | 66.98 | 64.81 | 46,406 |
| BRENT | 88.88 | -0.03% | +34.42% | 88.91 | 90.07 | 88.12 | 29,713 |
| WTI | 83.11 | -0.11% | +31.57% | 83.20 | 84.35 | 82.40 | 166,848 |
| COPPER | 6.61 | +0.03% | +46.70% | 6.61 | 6.71 | 6.61 | 39,543 |
| LITHIUM | 75.20 | +1.47% | +62.95% | 74.11 | 75.80 | 75.08 | 89,275 |
| IRON ORE | 161.91 | — | +58.10% | 161.91 | 161.91 | 1 | |
| SOY | 1,184 | +3.20% | +17.05% | 1,148 | 1,199 | 1,168 | 163,179 |
| CORN | 480.50 | +10.02% | +29.34% | 436.75 | 480.75 | 459.50 | 341,248 |
| WHEAT | 655.00 | +3.93% | +29.70% | 630.25 | 657.75 | 631.50 | 128,793 |
| COFFEE | 317.25 | -5.51% | +0.67% | 335.75 | 321.20 | 313.55 | 21,747 |
| SUGAR | 16.43 | -1.79% | -3.01% | 16.73 | 17.11 | 16.22 | 171,992 |
| COCOA | 5,719 | +3.18% | -34.96% | 5,543 | 5,779 | 5,574 | 26,773 |
| ORANGE JUICE | 138.55 | -0.47% | -45.38% | 139.20 | 141.05 | 137.50 | 703 |
| COTTON | 85.03 | +2.33% | +26.78% | 83.09 | 82.90 | 81.96 | 16,546 |
| BEEF | 223.60 | -3.93% | -5.18% | 232.75 | 226.40 | 223.00 | 16,126 |
| CATTLE | 339.10 | -3.16% | -1.82% | 350.17 | 345.50 | 338.60 | 10,164 |
| USD/BRL | 5.16 | +0.01% | -5.13% | 5.16 | 5.18 | 5.14 | — |
04Forward Look
\n
CPI on March 11, FOMC on March 17–18.
\n
February CPI on Tuesday is the week’s critical release. A hot print — driven by the energy surge already in the pipeline — would reinforce the “higher-for-longer” narrative and pressure gold toward $4,900. A cooler reading might briefly revive rate-cut hopes, but with oil above $110, markets are unlikely to price cuts before July. The FOMC statement and updated dot plot on March 18 will set the rate trajectory for Q2.
\n
\n
Iran War and Strait of Hormuz.
\n
Over the weekend, Israeli jets struck Iranian fuel depots and refineries on Saturday, prompting Iranian retaliatory strikes on U.S. sites in the UAE. Asian equities opened in freefall — Nikkei down 7%, KOSPI down 8%. A late Sunday hint from Trump that he and Netanyahu will make a joint decision on the war offers a glimmer of de-escalation hope, but until the Strait reopens and oil retreats below $90, precious metals face the paradox of bullish geopolitics and hawkish inflation simultaneously.
\n
\n
JPMorgan and Goldman Sachs Targets.
\n
JPMorgan maintains its year-end 2026 gold target of $6,300, projecting 585 tonnes of quarterly investor and central bank demand. Goldman Sachs targets $5,400 — the most conservative among major banks, with Deutsche Bank at $6,000 and UBS at $6,200. Both outlooks assume eventual rate cuts and persistent central bank accumulation. The current pullback from $5,589 ATH to $5,097 — an 8.8% correction — is well within the range of healthy consolidation in a structural bull market.
\n
\n
Silver’s Industrial Demand Backstop.
\n
Silver’s 32% discount to its January $121.62 ATH represents either a catch-up opportunity or a warning that the blow-off top may not be revisited soon. Solar panel demand, AI data center buildout, and defense applications provide a structural industrial floor. Analysts at CBS Marketwatch note that silver tends to amplify gold in both directions, and a gold recovery toward $5,400 would likely carry silver back toward $90–$95.
\n
\n
\n
\n
Key Facts
— Gold’s pullback to $5,097 is a correction within a generational bull market, not the beginning of a bear. The structural supports are formidable: central bank buying projected at 755 tonnes for 2026, ETF inflows accelerating ($5.3B in February alone), and the dollar in a secular weakening trend with DXY holding below 100. The January ATH of $5,589 was set during the initial Iran escalation; the metal is now consolidating 8.8% below that level, which is a normal retracement in a trend that has delivered over 100% gains in twelve months.
— The near-term risk is clear: oil above $110 keeps the Fed on hold and compresses gold’s rate-cut premium. If Brent pushes toward J.P. Morgan’s $120–$130 scenario, gold could test $4,900 before finding buyers. But any sign of de-escalation — a ceasefire, the Strait reopening, or oil retreating below $90 — would reignite the rate-cut trade and send gold back toward $5,400. Tuesday’s CPI is the near-term catalyst; the FOMC on March 18 is the medium-term pivot.
— Silver requires more caution. The 6% intraday swing on Friday demonstrated how quickly liquidity can evaporate, and the white metal’s 32% distance from its ATH suggests the January blow-off was partially speculative. However, the 200-SMA at $55 provides an enormous structural floor, and the gold/silver ratio at 61.6 is historically neutral. Silver above $80 is a bull market; below $72 (Bollinger lower) would signal a meaningful shift.
— Gold Bias: BULLISH on dips — structural bull intact, buy $4,900–$5,000 zone.
— Silver Bias: NEUTRAL — hold $80, needs gold recovery to retest $90+.
\n
\n
Disclaimer: This report is for informational purposes only and does not constitute investment advice. Precious metals trading involves significant risk of loss. Past performance is not indicative of future results. Always conduct your own research before making investment decisions. Data sourced from TradingView, Capital.com, USAGOLD, World Gold Council, JPMorgan, Goldman Sachs, Fortune, InvestingNews, CNBC, Reuters, BLS.gov, and Investing.com. © 2026 Rio Times Online.
\n
\n
\n
\n
\n
Related coverage: Brazil’s Ibovespa | Brazil’s Morning Call
This article was produced by The Rio Times’ automated newsroom system. How we use AI · Report an error · Editorial responsibility: Matthias Camenzind, Editor-in-Chief
Read More from The Rio Times