February 28, 2026 · Session of February 27
Bitcoin erases Wednesday’s bounce in full, sliding 5.2% to $63,986 as Iran geopolitical risk flared and hot US PPI data killed Fed cut hopes. The intraday low of $63,037 retested the February 5 crash zone. Over $260 million in leveraged positions were liquidated across crypto, with 70% long. The “dead cat bounce” narrative from $60K to $70K appears confirmed.
February closes at approximately −16.75%, marking the first time in Bitcoin’s history that both January and February have ended in the red. BTC is now down roughly 27% year-to-date and 49% from the October 2025 all-time high of $126,272. The Fear & Greed Index has spent most of the month in Extreme Fear territory, touching a low of 5 — a reading last seen during the FTX collapse.
ETF flows remain structurally mixed — $507M poured in on Wednesday only to see $27.5M exit on Thursday. The five-week outflow streak totaling $3.8B was broken mid-week, but net February outflows stand at approximately $179M. BlackRock quietly accumulated ~3,800 BTC ($235M) in three days even as spot prices fell, signaling institutional patience beneath the panic.
01Session Data
| Metric | Value | Chg |
|---|---|---|
| BTC/USD Close (Bitstamp) | 63,986 | −5.20% |
| Intraday High / Low | 66,017 / 63,037 | — |
| ETH/USD | ~2,026 | −1.6% |
| SOL/USD | ~86.44 | −2.0% |
| XRP/USD | ~1.42 | −3.7% |
| S&P 500 | 6,878.88 | −0.43% |
| Nasdaq Composite | 22,668.21 | −0.92% |
| VIX | 21.12 | +13.4% |
| DXY | 97.61 | −0.13% |
| Gold (XAUUSD) | $5,194.20 | −0.61% |
| 24h Liquidations | ~$260M | 70% longs |
| BTC ETF Net Flow (Feb 27) | −$27.5M | IBIT −$32.7M |
| BTC MTD | −16.75% | worst since Oct 2025 |
| BTC YTD | −27% | −49% from ATH |
| XAGUSDT (Silver) | +6.19% |
| XAUTUSDT (Gold) | +4.01% |
| PAXGUSDT | +4.48% |
| XAUUSDT (Gold) | +2.87% |
| RIVERUSDT | +5.22% |
| ZECUSDT | −14.61% |
| SUIUSDT | −12.86% |
| SOLUSDT | −11.14% |
| ADAUSDT | −10.94% |
| PIPPINUSDT | −10.34% |
02Market Commentary
Wednesday’s relief rally to $70,000 lasted exactly 24 hours. Bitcoin opened Friday’s session already weakened at $65,868 after overnight selling that began when Ambassador Mike Huckabee reportedly instructed US embassy staff in Jerusalem to leave the country — a move widely interpreted as preparation for military action against Iran. The token tumbled from $68,000 to $65,500 in under three hours as Middle East desks began pricing in Strait of Hormuz disruption risk.
The macro backdrop provided no relief. US PPI for January printed +0.5% headline and +0.8% core, both well above the 0.3% consensus, sending the probability of a May Fed rate cut from 65% to below 15%. Higher-for-longer rates are poison for non-yielding assets, and the crypto complex sold off in lockstep with Nasdaq. The Dow shed 521 points, the S&P 500 fell 0.43%, and the VIX surged past 21 — its highest since early February.
The digital gold thesis faced its starkest challenge. While Bitcoin was cratering, tokenized gold products surged — XAUUSDT gained 2.87%, PAXGUSDT added 4.48%, and silver’s XAGUSDT rallied 6.19%. The disparity underscores that in genuine geopolitical fear, capital flees to physical-backed stores of value, not speculative digital assets. Bitcoin now correlates more closely with Nasdaq than with any safe-haven benchmark.
Altcoins were decimated. Zcash dropped 14.61%, SUI lost 12.86%, Solana shed 11.14%, and Cardano declined 10.94%. The only green on the Hyperliquid board came from precious metals, a handful of micro-cap meme tokens, and GWEIUSDT (+25.17%). Even with weekly gains still intact for some altcoins as of Friday morning, the session-end carnage erased most of those advances. Over 96,000 traders were liquidated in 24 hours, with $260 million wiped out — 70% from long positions.
03Technical Analysis
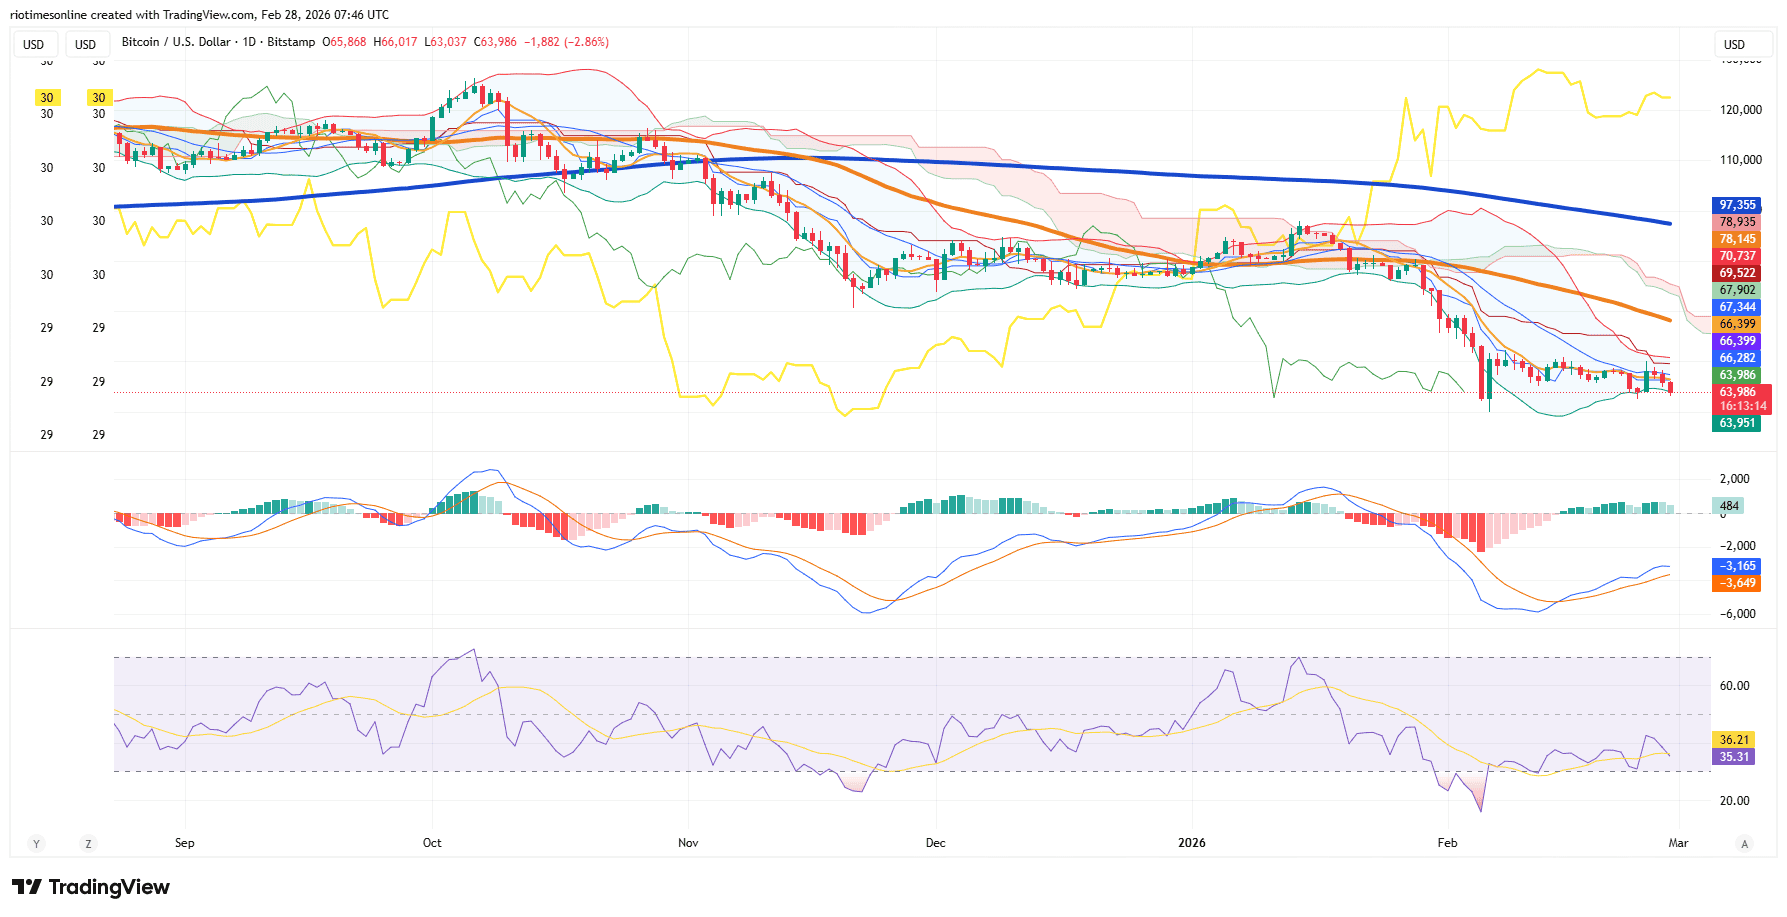
The daily chart is deeply bearish on all major frameworks. Price closed at $63,986, well below the Ichimoku cloud — the Tenkan-sen sits at approximately $67,344 and the Kijun-sen at $69,522, both overhead. The cloud itself spans $78,145 to $70,737, with the 200-day SMA towering at $97,355 — a staggering 52% above current price. Every major moving average is acting as resistance.
The RSI reads 36.21 with a signal line at 35.31, hovering in the lower third of the oscillator range but not yet at the classic 30 oversold threshold. This leaves room for further downside before a technical bounce triggers. The MACD remains in deep negative territory at −3,165 versus signal −3,649, though the histogram has ticked positive to 484 — the first green histogram bar in several sessions, hinting at a potential deceleration of bearish momentum.
The key battle is the $63,000–$64,000 zone. This was the intraday low on both February 5 and February 27, forming a double bottom pattern on the daily chart. Bloomberg’s Mike McGlone has identified $64,000 as the floor that must hold, warning that a clean break could send BTC toward $60,000 and trigger cascading liquidations across equity markets. The $60,000 level aligns with the 200-day moving average’s support zone identified by VanEck, where Bitcoin’s realized price — the average cost basis of all holders — also clusters.
| Level | Price | Source |
|---|---|---|
| Resistance 3 | $97,355 | 200-day SMA |
| Resistance 2 | $69,522 | Kijun-sen |
| Resistance 1 | $67,344 | Tenkan-sen |
| Close | $63,986 | Feb 27 Bitstamp daily close |
| Support 1 | $63,037 | Feb 27 intraday low / Feb 5 crash zone |
| Support 2 | $60,074 | Feb 23 weekly low / psychological $60K |
| Support 3 | $58,000 | 200-DMA zone / realized price cluster |
04Forward Look
Iran Escalation → The weekend is the highest-risk window. Israel has declared a state of emergency and Iran rejected US uranium demands. If strikes materialize, Bitcoin — as one of the few large liquid assets tradeable on weekends — will likely see another sharp leg down as traders exit risk before Monday equity opens.
March 1 Clarity Date → Analysts have flagged March 1 as a potential inflection point, with upcoming clarity on several macro and regulatory fronts. If the date passes without further geopolitical escalation, the oversold conditions (RSI 36, Fear & Greed 16) could fuel a sharp short squeeze.
ETF Flow Signals → The mid-week $507M inflow (with BlackRock’s IBIT taking $297M) demonstrated that institutional appetite can return rapidly. Balchunas noted ETF investors have shown “absurd” resilience through a 50% drawdown, selling only $6.5B against $55B in total inflows. A sustained shift back to positive weekly flows remains the key signal for trend reversal.
$60K or $70K First? → Deribit reports that ETF holders and corporate treasuries are buying $60K strike puts expiring in 6-12 months, revealing institutional hedging against further downside. Yet Bernstein maintains its $150K price target for 2026 and VanEck’s analysis shows that Bitcoin’s distance from its 200-DMA (−2.88σ) is at an all-time extreme — historically a contrarian buy signal. The range is clear: $60K–$70K until something breaks.
05Verdict
February’s crypto market will be remembered as the month that shattered the “digital gold” narrative. Bitcoin lost 16.75% while physical gold hit new all-time highs above $5,300. In every geopolitical shock this month — Iran tensions, tariff confusion, AI anxiety — Bitcoin sold off with equities rather than rallying with safe havens. The correlation with Nasdaq is now the dominant factor in crypto price discovery.
The technical picture is grim but not hopeless. The double bottom forming at $63,000 (Feb 5 and Feb 27) is a recognized reversal pattern, and the positive MACD histogram tick suggests selling momentum is decelerating. The RSI at 36 is approaching but hasn’t yet reached oversold territory, meaning a washout to $60K would likely produce the capitulation signal bears need to step aside.
The contrarian case rests on extremes. Fear & Greed at 16 is in the zone that historically precedes major bottoms. VanEck’s data shows Bitcoin trading 2.88 standard deviations below its 200-DMA — a reading with zero precedent in 10 years, including COVID and FTX. The five-week ETF outflow streak was broken mid-week, and BlackRock’s quiet accumulation of 3,800 BTC while headlines screamed capitulation is the kind of smart-money signal that matters more than sentiment gauges.
The weekend is the immediate risk. If Iran strikes materialize, BTC will be the pressure valve for global fear while traditional markets are closed. A test of $60,000 cannot be ruled out. But for patient allocators with longer horizons, this is precisely the kind of blood-in-the-streets environment that has preceded every major Bitcoin recovery cycle. The question is whether $64K holds — or whether the market needs one more flush before the structural bid reasserts itself.