This is how the price per square meter has moved in Latin America in the last 5 years
By Juan Pablo Álvarez
A study that takes into account 14 Latin American cities shows that the price of the average square meter of properties in Guadalajara, Mexico, increased more than 42% in the five years from September 2017 to September 2022, while in Rio de Janeiro, Brazil, the price per square meter collapsed almost 73% in the same period.
In Argentine cities, very significant drops in the prices of houses and apartments are observed.
The data comes from a report by the Universidad Torcuato Di Tella, located in Argentina, and takes into account 14 districts in the region (Bogota, Buenos Aires, Mexico City, Panama City, Cordoba, Guadalajara, Lima, Monterrey, Montevideo, Quito, Rio de Janeiro, Rosario, São Paulo, and Santiago).

Bloomberg Línea delved into how property prices moved in these five years in each city.
BOGOTA
As of September 2022, Colombia’s capital city had the cheapest square meter among the above districts (US$1,108).
The price fell by 29.24% between September 2017 and September 2022.
BUENOS AIRES
In Buenos Aires, the m² cost US$2,421 as of September 2022, taking the alternative dollar quotation (since Argentina has a strong exchange rate repression).
At that time, it was the fourth most expensive city among the 14 cities mentioned, although the price plummeted 17.39% in those five years.
MEXICO CITY
In the Mexican capital, property prices rose 4.5% between September 2017 and September 2022 to stand in the latter period at US$2,424 per m².
It is the third most expensive city among those mentioned, after Montevideo and Santiago.
PANAMA CITY
In the Panamanian capital, the square meter cost, as of September last year, is about US$1,703, which implies a price drop of 14.33% compared to five years ago.
CORDOBA
In the Argentine city of Cordoba, as of September of last year, a square meter cost about US$1,1279, representing a 36.12% drop from the prices observed five years earlier.
GUADALAJARA
The Mexican city of Guadalajara is where prices per square meter have risen the most among the 14 Latin American cities studied.
As of September 2022, it cost US$1,969, i.e., 42.36% more than observed five years earlier.
LIMA
The average square meter of property in Lima, the capital of Peru, was around US$2,014 in September 2022.
This implies an increase of 3.23% over September 2017 values.
MONTERREY
In Monterrey, Mexico, properties rose 26.05% over the period studied, from 1,519 in September 2017 to 2,054 in September 2022.
MONTEVIDEO
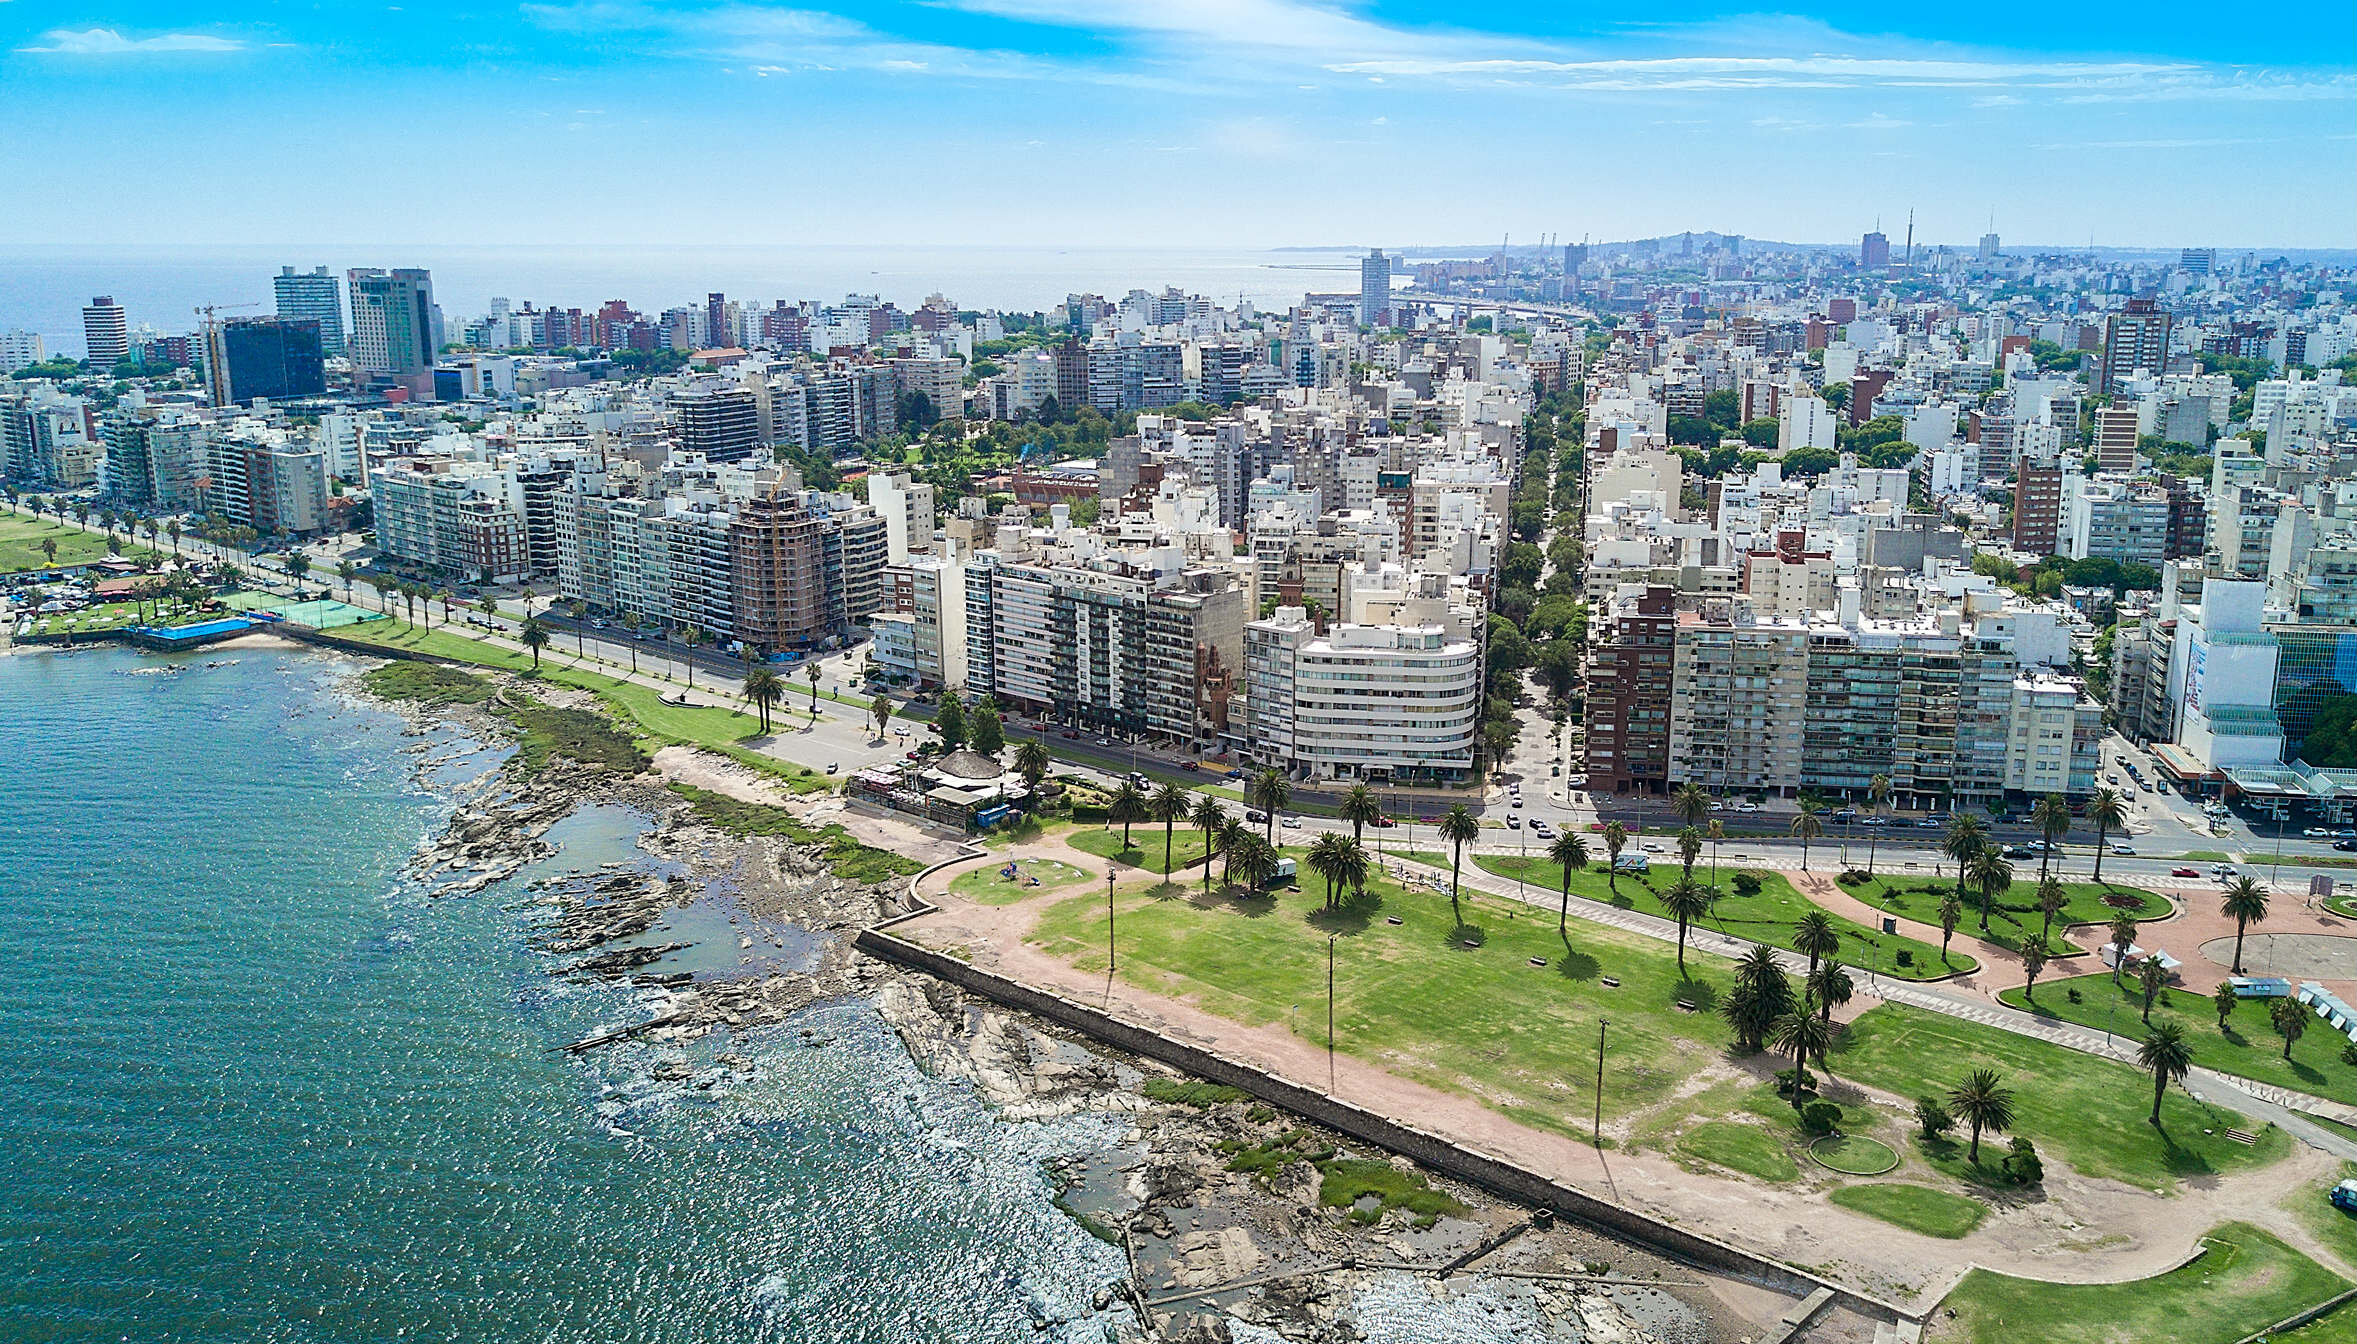
The Uruguayan capital, Montevideo, had the most expensive square meter among the cities mentioned in September 2022: US$3,054.
Concerning the September 2017 price, an increase of 3.96% was seen.
QUITO
The city of Quito was, in September 2022, the second capital city with the cheapest square meter, behind Bogota: US$1,204.
Concerning the price observed five years ago, a drop of 14.53% is seen.
RIO DE JANEIRO
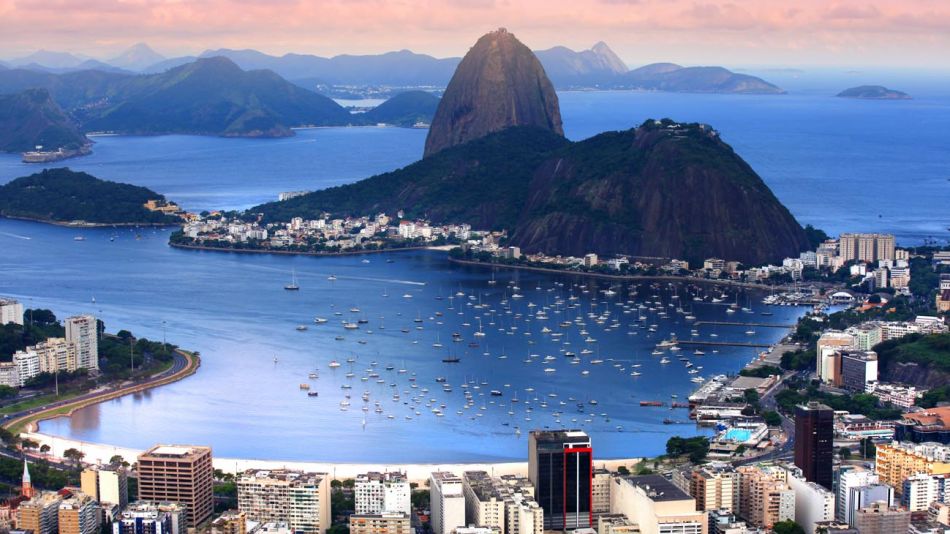
Property prices collapsed the most in Rio de Janeiro, Brazil, between September 2017 and September 2022: 72.89%.
The last price published by Torcuato Di Tella University was US$2,291.
ROSARIO
The Argentine city of Rosario is the fourth cheapest in properties among those mentioned: as of September 2022, it cost US$1,490 per sqm.
Property prices there have plummeted 22.68% in five years.
SÃO PAULO
The square meter in Brazil’s largest city cost an average of US$2,109 per square meter in September 2022.
This represents a drop of 25.41% concerning prices five years earlier.
SANTIAGO
The Chilean capital is the city with the second highest property prices, at least among those studied: as of September, it cost US$2,724 per m².
Even so, prices plummeted 23.05% in five years.
With information from Bloomberg
Read More from The Rio Times