IBOV 187,206.89 ▼ 0.56% IPSA 11,220.60 ▼ 0.16% IPC MEX 63,924.77 ▼ 0.28% MERVAL 3,098,898 ▼ 1.87% COLCAP 2,589.69 ▼ 1.41% BVL PERÚ 59,373.28 ▼ 0.32% USD/BRL5.13▲ 0.40% USD/MXN16.96▼ 0.14% USD/CLP941.13— 0.00% USD/COP3,077▼ 1.03% USD/PEN3.35▲ 0.03% USD/ARS1,509▼ 0.28% USD/UYU40.26▲ 3.12% USD/PYG5,903▲ 3.23% USD/BOB11.98▼ 2.70% USD/DOP58.96▲ 0.79% USD/CRC447.55▲ 1.57% USD/GTQ7.63▲ 2.98% USD/HNL26.85▲ 0.57% USD/NIO36.62— 0.00% USD/VES830.41▼ 0.13% USD/PAB1.00— 0.00% USD/BZD2.00— 0.00% USD/JMD 157.28 — 0.00% USD/TTD6.74▲ 2.35% EUR/BRL5.95▲ 0.25% BRENT 88.88 ▼ 0.03% WTI 83.11 ▼ 0.11% IRON ORE 161.91 — — COPPER 6.61 ▲ 0.03% GOLD 4,461 ▲ 1.78% SILVER 65.59 ▲ 1.26% SOY 1,184 ▲ 3.20% CORN 480.50 ▲ 10.02% WHEAT 655.00 ▲ 3.93% COFFEE 317.25 ▼ 5.51% SUGAR 16.43 ▼ 1.79% ORANGE JUICE 138.55 ▼ 0.47% COTTON 85.03 ▲ 2.33% COCOA 5,719 ▲ 3.18% BEEF 223.60 ▼ 3.93% CATTLE 339.10 ▼ 3.16% LITHIUM 75.20 ▲ 1.47% PETR4 41.64 ▼ 0.05% VALE3 72.97 ▲ 0.83% ITUB4 38.60 ▼ 1.03% BBDC4 16.85 ▲ 0.36% ABEV3 14.89 ▼ 0.80% BBAS3 19.37 ▲ 0.47% B3SA3 14.26 ▼ 0.21% WEGE3 47.59 ▲ 0.49% PRIO3 59.14 ▼ 0.19% SUZB3 41.33 ▲ 2.35% RENT3 34.68 ▼ 0.09% AZZA3 15.89 ▼ 2.63% CSAN3 3.22 ▼ 1.83% RAIZ4 0.25 — 0.00% PCAR3 2.75 ▼ 0.36% GMAT3 3.65 ▼ 1.08% PSSA3 48.13 ▼ 0.54% CVCB3 1.33 ▼ 2.92% POSI3 3.36 ▲ 2.44% SLCE3 13.34 ▲ 0.30% NATU3 8.14 ▼ 0.73% IBOV 187,206.89 ▼ 0.56% IPSA 11,220.60 ▼ 0.16% IPC MEX 63,924.77 ▼ 0.28% MERVAL 3,098,898 ▼ 1.87% COLCAP 2,589.69 ▼ 1.41% BVL PERÚ 59,373.28 ▼ 0.32% USD/BRL 5.16 ▲ 0.01% USD/MXN 17.06 ▼ 0.24% USD/CLP 913.98 ▲ 0.04% USD/COP 3,140 ▲ 0.03% USD/PEN 3.36 ▼ 0.66% USD/ARS 1,493 ▲ 0.10% USD/UYU 40.27 ▲ 1.24% USD/PYG 5,939 ▲ 1.68% USD/BOB 11.64 ▼ 0.76% USD/DOP 58.34 ▲ 1.25% USD/CRC 445.92 ▲ 0.89% USD/GTQ 7.62 ▲ 2.21% USD/HNL 26.79 ▲ 1.57% USD/NIO 36.62 ▲ 0.69% USD/VES 762.44 ▼ 0.13% USD/PAB 1.00 — 0.00% USD/BZD 2.00 — 0.00% USD/JMD 157.28 — 0.00% USD/TTD 6.70 ▲ 0.61% EUR/BRL 5.95 ▲ 1.01% BRENT 88.88 ▼ 0.03% WTI 83.11 ▼ 0.11% IRON ORE 161.91 — — COPPER 6.61 ▲ 0.03% GOLD 4,461 ▲ 1.78% SILVER 65.59 ▲ 1.26% SOY 1,184 ▲ 3.20% CORN 480.50 ▲ 10.02% WHEAT 655.00 ▲ 3.93% COFFEE 317.25 ▼ 5.51% SUGAR 16.43 ▼ 1.79% ORANGE JUICE 138.55 ▼ 0.47% COTTON 85.03 ▲ 2.33% COCOA 5,719 ▲ 3.18% BEEF 223.60 ▼ 3.93% CATTLE 339.10 ▼ 3.16% LITHIUM 75.20 ▲ 1.47% PETR4 41.64 ▼ 0.05% VALE3 72.97 ▲ 0.83% ITUB4 38.60 ▼ 1.03% BBDC4 16.85 ▲ 0.36% ABEV3 14.89 ▼ 0.80% BBAS3 19.37 ▲ 0.47% B3SA3 14.26 ▼ 0.21% WEGE3 47.59 ▲ 0.49% PRIO3 59.14 ▼ 0.19% SUZB3 41.33 ▲ 2.35% RENT3 34.68 ▼ 0.09% AZZA3 15.89 ▼ 2.63% CSAN3 3.22 ▼ 1.83% RAIZ4 0.25 — 0.00% PCAR3 2.75 ▼ 0.36% GMAT3 3.65 ▼ 1.08% PSSA3 48.13 ▼ 0.54% CVCB3 1.33 ▼ 2.92% POSI3 3.36 ▲ 2.44% SLCE3 13.34 ▲ 0.30% NATU3 8.14 ▼ 0.73%
since 2009
Sunday, September 13, 2026

Uruguay Cuts Poverty: A Sharp Contrast with Argentina

By · September 30, 2023 · 2 min read

The LatAm Brief

One email, every weekday morning. What moved in Latin American markets, politics and expat life.

Yesterday’s subject line: “'The false peace is over' - Colombia”

Free. We send a confirmation link first — nothing arrives until you click it. Unsubscribe with one click in any edition. If you stop opening us for 30 days we stop sending by ourselves, as we assume the interest is no longer there. See our privacy policy. We never share your email.

Uruguay’s government reported that only 10.4% of its population couldn’t meet basic needs in the first-half poverty statistics.

Extreme poverty is at a mere 0.2%. Meanwhile, Argentina reported a 40.1% poverty rate, affecting over 18 million people.

The data show a large gap between the two neighboring countries. Uruguay’s poverty fell from 10.7% in the first half of last year. That’s a 0.3% drop.

Argentina paints a different picture. There, 9.3% can’t even afford basic food. In Uruguay, this number is just 0.2%.

Economists in Uruguay highlighted these differences on social media. Aldo Lema said 10.4% were below the poverty line this year, compared to 10.7% last year.

Nicolás Cichevski, another analyst, gave more data. He noted that the current poverty rate is higher than the first half of 2019, which was 8.6%.
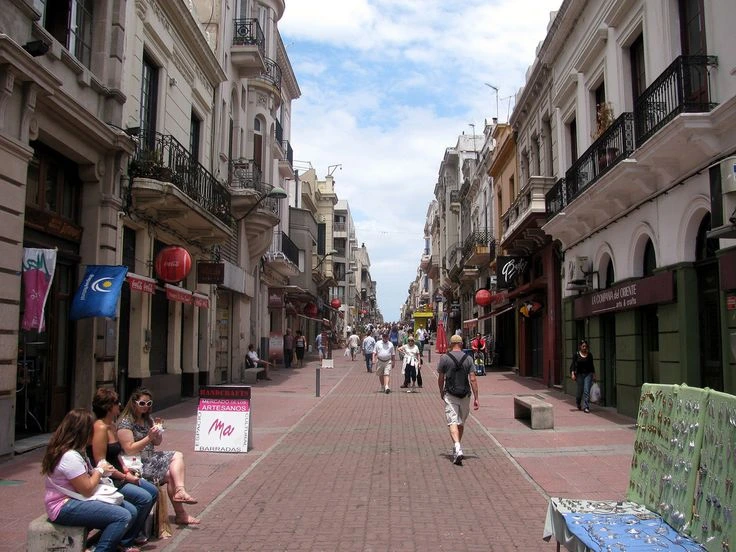
Uruguay Cuts Poverty: A Sharp Contrast with Argentina.
One-stop reference
Company Intelligence
Every listed company in Latin America — financials, ownership and structure for 1,450+ companies across 26 exchanges, in one place.
Browse the directory →
RT
Ask Rio Times
17 years of Latin America reporting, on demand.
Open the full Ask Rio Times →

“The second half of 2022 showed similar rates to 2019,” he added.

The figures show two diverging economies. Why is Uruguay succeeding where Argentina is not? It could be a mix of policies, programs, and governance.

Why is Uruguay Succeeding?

Uruguay seems more stable than Argentina. This stability likely helps in reducing poverty. Still, there’s room for improvement in Uruguay.

Argentina could learn from Uruguay’s tactics. However, applying the same strategies may not be straightforward.

Lastly, Uruguay’s 0.3% drop in poverty suggests cautious optimism. Even though it’s above the 2019 level, it’s an improvement.

If this continues, it could mark a path towards better economic health.

Background on Uruguay vs Argentina Poverty

Adding to this, the role of effective governance in Uruguay cannot be ignored. Policies seem to be working well, as evidenced by the falling poverty rate.

The difference in extreme poverty between the two nations is also worth noting. With only 0.2% in Uruguay, it shows a more equitable distribution of wealth.

One point of caution: the lack of child poverty data is a gap. Understanding this component is crucial for a fuller picture of social health.

Public opinion in Uruguay could become a factor too. If people see positive trends, it could influence upcoming elections.

Meanwhile, Argentina faces a tough road ahead. With such high poverty and extreme poverty rates, urgent action is required.

In conclusion, both nations offer lessons. Uruguay exemplifies what’s possible with effective policies and stability.

Argentina serves as a warning, illuminating what could go wrong without these elements.

This article was produced by The Rio Times’ automated newsroom system. How we use AI · Report an error

Read More from The Rio Times

The Rio Times · Power Map
See who really holds power in Latin America
Click to open the Power Map

Rotate for Best Experience

This report is optimized for landscape viewing. Rotate your phone for the full experience.